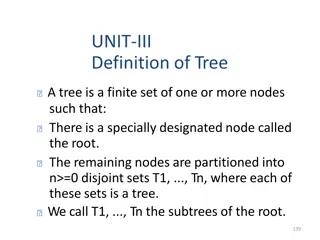
Introduction to Network and Tree Graphs

 undefined


Network & Tree Graphs


Graphs, Networks, Trees
•
The two terms "graph" and "network" are both used in
several different ways. Following Dave Winer, the term
"graph" is used to refer to (amongst other things):
▫
a visual representation of the variation of one variable in
comparison with that of one or more other variables
▫
a
mathematical concept
of a set of nodes connected by
links called edges
▫
a
data structure
based on that mathematical concept
•
The term "network" is also used in several ways, including:
▫
an interconnected system of things (inanimate objects or
people)
▫
a
specialized type of graph
(the mathematical concept)
•
Trees are subsets of graphs/networks.
Trees are Limited Version of Graphs
•
Subcase of general graph
•
No cycles
•
Typically directed edges
•
Special designated root vertex
Tree Hierarchies in the World
•
Pervasive
▫
Family histories, ancestries
▫
File/directory systems on computers
▫
Organization charts
▫
Animal kingdom: Phylum,…, genus,…
▫
Object-oriented software classes
▫
...
Trees
•
Hierarchies often represented as trees
▫
Directed, acyclic graph
•
Two main representation schemes
▫
Node-link
▫
Space-filling
Node-Link Representations
Node-Link Diagrams
•
Root at top, leaves at bottom is very common
Sample Representation
From: Johnson & Shneiderman, ‘91
Examples
•
Good for
▫
Search
•
Bad for
▫
Understanding
Structure
Why Put Root at Top?
•
Root can be at
center with levels
growing outward too
•
Can any node be the
root?
Drawing a Tree
•
How does one draw this?
▫
DFS
▫
Percolate requirements upward
Potential Problems
•
For top-down, width of fan-out uses up
horizontal real estate very quickly
▫
At level n, there are 2n nodes
•
Tree might grow a lot along one particular
branch
▫
Hard to draw it well in view without
knowing how it will branch
InfoVis Solutions
•
Techniques developed in Information
Visualization largely try to assist the problems
identified in the last slide
•
Alternatively, Information Visualization
techniques attempt to
▫
show more attributes of data cases in
hierarchy
▫
or focus on particular applications of trees
SpaceTree
•
Uses conventional 2D layout techniques
with
some clever additions
Grosjean, Plaisant, Bederson
InfoVis ‘02
Characteristics
•
Vertical or horizontal
•
Subtrees are triangles
▫
Size indicates depth
▫
Shading indicates number of nodes inside
•
Navigate by clicking on nodes
▫
Strongly restrict zooming
Design Features
•
Make labels readable
•
Maximize number of levels opened
•
Decompose tree animation
•
Use landmarks
•
Use overview and dynamic filtering
3D Approaches
•
Add a third dimension into which layout can go
•
Compromise of top-down and centered
techniques mentioned earlier
•
Children of a node are laid out in a cylinder
“below” the parent
▫
Siblings live in one of the 2D planes
Cone Trees
•
Developed at Xerox PARC
•
3D views of hierarchies such as file systems
Robertson, Mackinlay, Card
CHI ‘91
Alternate Views
Cone Trees
Positive
Negative
•
More space available
to lay out tree
•
Aesthetically pleasing
(?)
•
As in all 3D, occlusion
obscures some nodes
•
Is it really more
efficient? For what
tasks/users/contexts?
Hyperbolic Browser
•
Example:
BlogWorld
(
YouTube video
)
•
Focus + Context Technique
▫
Detailed view blended with a global view
•
First lay out the hierarchy on the hyperbolic
plane
•
Then map this plane to a disk
•
Start with the tree’s root at the center
•
Use animation to navigate along this
representation of the plane
Lamping and Rao,
JVLC ‘96
2D Hyperbolic Browser
•
Approach: Lay out the
hierarchy on the hyperbolic
plane and map this plane
onto a display region.
•
Comparison
▫
A standard 2D browser
100 nodes (w/3 character
text strings)
▫
Hyperbolic browser
1000 nodes, about 50
nearest the focus can show
from 3 to dozens of
characters
Clicking on the blue
node brings it into
focus at the center
Key Attributes
•
Natural magnification (fisheye) in center
•
Layout depends only on 2-3 generations from
current node
•
Smooth animation for change in focus
•
Don’t draw objects when far enough from
root (simplify rendering)
Problems
•
Orientation
▫
Watching the view can be disorienting
▫
When a node is moved, its children don’t
keep their relative orientation to it as in
Euclidean plane, they rotate
▫
Not as symmetric and regular as Euclidean
techniques, two important attributes in
aesthetics
Performance
•
Handle much larger graphs, i.e. >100,000
edges
•
Support dynamic exploration & interactive
browsing
•
Maintain a guaranteed frame rate
•
Example code base (javascript):
Hypetree.js
How about 3D?
•
Can same hyperbolic transformation be
applied, but now use 3D space?
Munzner,
IEEE CG&A ‘98
Old School
•
After all the interest in 3D and hyperbolic
techniques in the ’90’s, recently, there has
been renewed interest in the old 2D methods
(just done better)
▫
SpaceTree presented earlier
▫
Next 3 papers…
Degree-of-Interest Trees
•
Problem
▫
Trees quickly degrade into line (example
below)
•
Approach
▫
Use fisheye-like focus & context ideas to
control how a tree is drawn
Approach
•
Combine multiple ideas
▫
Expanded DOI computation
▫
Logical filtering to elide
nodes
▫
Geometric scaling
▫
Semantic scaling
▫
Clustered representation of
large unexpended branches
▫
Animated transition
Example Operations
Compression
•
For nodes: compress to fit (compress in X or in Y)
•
Within-node compression
▫
Data deletion
▫
Word abbreviation
▫
Node rotation
Better View of Org Chart
FlexTree
•
Horizontally-drawn tree with compression
along vertical dimension
•
One focus is on showing decision trees well
•
Contextual multi-foci view
•
Basic idea: Push all nodes down as far as you
can
Song, Curran & Sterritt
Information Visualization ‘04
Example
Bar Chart and Partial Views
Node-link Shortcomings
•
Difficult to encode more variables of data
cases (nodes)
▫
Shape
▫
Color
▫
Size
▫
…but all quickly clash with basic node-link
structure
Space-Filling Representations
•
Each item occupies an area
•
Children are “contained” under parent
Treemap
•
Space-filling representation developed by
Shneiderman and Johnson, Vis ‘91
•
Children are drawn inside their parent
•
Alternate horizontal and vertical slicing at
each successive level
•
Use area to encode other variable of data
items
Example
Example
Example
Treemap?
http://blog.wired.com/wiredscience/2008/06/awesome-infogra.html
Treemap Affordances
•
Good representation of two attributes beyond
node-link: color and area
•
Not as good at representing structure
▫
What happens if it’s a perfectly balanced
tree of items all the same size?
▫
Also can get long-thin aspect ratios
▫
Borders help on smaller trees, but take up
too much area on large, deep ones
Aspect ratios
Early Treemap Applied to File System
A Good Use of TreeMaps and Interactivity
www.smartmoney.com/marketmap
Treemaps in Peets site
News Stories
http://newsmap.jp/
Variation: “Cluster” Treemap
•
SmartMoney.com Map of the Market
▫
Illustrates stock movements
▫
“Compromises” treemap algorithm to avoid
bad aspect ratios
▫
Basic algorithm (divide and conquer) with
some hand tweaking
▫
Takes advantage of shallow hierarchy
Wattenberg
CHI ‘99
http://www.smartmoney.com/marketmap
SmartMoney Review
•
Tufte-esque micro/macro view
•
Dynamic user interface operations add to
impact
•
One of better applications of InfoVis
techniques we’ve seen
Summary of Variations
The World of Treemaps
Maryland HCIL
website devoted
to Treemaps
Workshop in
2001 there on
topic
www.cs.umd.edu/hcil/treemap-history/
Another Technique
•
What if we used a radial rather than a
rectangular space-filling technique?
▫
We saw node-link trees with root in center
and growing outward already...
•
Make pie-tree with root in center and children
growing outward
▫
Radial angle now corresponds to variables
rather than area
Sunburst
:
Demonstration
of System
http://www.cc.gatech.edu/gvu/ii/sunburst/
SunBurst
•
Root directory at center, each successive level
drawn farther out from center
•
Sweep angle of item corresponds to size
•
Color maps to file type or age
•
Interactive controls for moving deeper in
hierarchy, changing the root, etc.
•
Double-click on directory makes it new root
http://www.cc.gatech.edu/gvu/ii/sunburst/
SunBurst (cons)
•
In large hierarchies, files at the periphery are
usually tiny and very difficult to distinguish
InterRing
•
Follow-on to Sunburst that provides fixes and
new operations….
Yang, Ward & Rudensteiner
InfoVis ‘02
InterRing extended Sunburst
•
Sunburst extended to incorporate interactive
distortion based zooming (InterRing model).
Mike Bostock’s
Interactive Demo
and
GitHub code
Summary: NodeLink vs SpaceFilling
•
Node-link diagrams or space-filling
techniques?
•
It depends on the properties of the data
▫
Node-link typically better at exposing
structure of information structure
▫
Space-filling good for focusing on one or two
additional variables of cases
Interaction as Key for Large Trees
•
While the various techniques have helped
some in visualizing trees, especially large
ones, I believe the most important things is
the addition of interaction (navigation,
clustering, ghosting, etc).
•
Example:
Life on Earth
museum exhibit
Network Graphs
•
Networks are different from tree graphs.
•
They do not have a root, and can have any
connections between nodes.
•
They may include directed links.
Twitter Network
•
http://apps.asterisq.com/mentionmap/
•
Explores your twitter network
Network Graphs show Connections
•
Connections throughout our lives and the
world
▫
Circle of friends
▫
Delta’s flight schedules
▫
…
•
Model connected set as a Graph
What is a Graph?
•
Vertices (nodes) connected by
•
Edges (links)
Graph Terminology
•
Graphs can have cycles
•
Graph edges can be directed or undirected
•
The degree of a vertex is the number of edges
connected to it
▫
In-degree and out-degree for directed
graphs
•
Graph edges can have values (weights) on
them (nominal, ordinal or quantitative)
Graph Uses
•
In information visualization, any number of data
sets can be modeled as a graph
▫
US telephone system
▫
World Wide Web
▫
Distribution network for on-line retailer
▫
Call graph of a large software system
▫
Semantic map in an AI algorithm
▫
Set of connected friends
•
Graph/network visualization is one of the oldest
and most studied areas of InfoVis
Graph Visualization Challenges
•
Graph layout and positioning
▫
Make a concrete rendering of abstract graph
•
Navigation/Interaction
▫
How to support user changing focus and
moving around the graph
•
Scale
▫
Above two issues not too bad for small
graphs, but large ones are much tougher
Layout Algorithms
http://www.ics.forth.gr/gd2008/
Layout Heuristics
•
Layout algorithms can be
▫
planar
▫
grid-based
▫
orthogonal
▫
curved lines
▫
hierarchies
▫
circular
▫
...
Common Layout Techniques
•
Force-directed
(gravity “pulls” vertices
together)
•
Circular
(laid out on a circle, or a sphere, or
the perimeter of a circle (Circos))
•
Geographic-based
(spatial coordinates, or
location in space based on similarity)
•
Clustered
(cluster by similarity)
•
Attribute-based
positioned by attribute
values, for example clustered together
•
Matrix
row/column orientation
Vertex Choices
•
Shape
: Symbols/Glyphs for vertices could show
maybe 5-10 distinguishable. Or could show
people’s pictures in boxes (unique but
distinguishable only at small scale).
•
Color:
categorical (10-12) colorings
•
Size
: could scale vertex to show
ordinal/interval/continuous. But difficult to tell
difference. Obscuration a problem.
•
Location
: could pull together “similar” vertices
(separate from edge effects) to group.
•
Label
: Could add labels to vertices, but layout
problems.
Edge Choices
•
Thickness
(width): ordinal/interval/continuous.
Effective, natural. Works up until very large scale.
•
Length:
distance between nodes shows strength.
•
Color
: use colors to denote strength of relationship
(ordinal/interval/continuous monochrome scale).
Probably hard to distinguish at scale.
•
Label
: can label, but not immediately perceived
(cognitive processing) and increases clutter
significantly.
•
Form
: to show different types of relationships (dotted,
dashed, full line, etc).
•
Direction
: can have arrows at end to indicate direction
Layout Recommendations
•
Planar in most cases, force directed to capture
magnitude of edge relation OR another
variable. Also cluster/attribute based can be
good choice (Action Science Explorer).
•
Circles Perimeters are good to emphasize
connections between equal things (on
perimeter). Circos
•
Sphere (good for large scale large number of
nodes to provide interactive focus zoom).
Vertex Recommendations
Make use of node to depict at least one attribute.
Color
is most effective if you want to categorically
label nodes.
Pictures
are good on social networks (when
zoomed in).
Symbols/glyphs
for small number of categories if
natural shapes (other color generally better).
Label
Often good for nodes; semantic zoom so
readable at all times if possible.
Size
can be helpful to show continuous variable
magnitude (at small scale when occlusion isn’t too
bad).
Edge Recommendations
•
Length:
Most natural for showing strength of
relationship.
•
Thickness
(width): OK choice. Easy to perceive
differences, easy to understand. But can make
busy, and harder to perceive when busy.
•
Color
: Good if small number of categories and
not large scale or muddled.
•
Label
: Generally not helpful for edges (just
increases clutter).
•
Form
: Sometimes good, but adds clutter, hard to
see at large scale.
•
Direction
: when semantically meaningful
Network Attributes Vocabulary
•
Bary center
– total shortest path of a node to all other
nodes
•
Betweenness centrality
– how often a node appears
on the shortest path between all other nodes
•
Closeness centrality
– how close a node is compared
to all other nodes
•
Cut-points
– the subgraph becomes disconnected if
the node is removed
•
Degree
– number of connections for node
•
HITs
– “hubs and authorities” measure
•
Power centrality
– how linked a node is to rest of
network
Aesthetic Considerations
•
Crossings
▫
minimize towards planar
•
Total Edge Length
▫
minimize towards proper scale
•
Area
▫
minimize towards efficiency
•
Maximum Edge Length
▫
minimize longest edge
•
Uniform Edge Lengths
▫
minimize variances
•
Total Bends
▫
minimize orthogonal towards straight-line
Which Matters?
•
Various studies examined which of the
aesthetic factors matter most and/or what
kinds of layout/vis techniques look best
▫
Purchase, Graph Drawing ’97
▫
Ware et al, Info Vis 1(2)
▫
Ghoniem et al, Info Vis 4(2)
▫
van Ham & Rogowitz, TVCG ‘08
▫
…
•
Results mixed: one generalized finding--Edge
crossings do seem important (minimize)
Shneiderman’s NetViz Nirvana
•
Every node is visible
•
For every node you can count its degree
•
For every link you can follow it from source to
destination
•
Clusters and outliers are identifiable
Scale Challenge
•
May run out of space for vertices and edges
(turns into “ball of string”)
•
Very large datasets can reduce rendering
speeds to less than realtime.
•
Often use clustering to help
▫
Extract highly connected sets of vertices
▫
Collapse some vertices together
Navigation/Interaction Issues
•
How do we allow a user to query, visit, or
move around a graph?
•
Changing focus may entail a different
rendering
Social Analysis
•
Facilitate understanding of complex
socioeconomic patterns
•
Social Science visualization gallery (Lothar
Krempel):
http://www.mpifg.de/~lk/netvis/substanz.html
Next slide: Krempel & Plumper’s study of World Trade between OECD countries,
1981 and 1992. The structure of world trade of between 28 OECD countries in
1981 and 1992. The size of the nodes gives the volume of flows in dollars
(imports and exports) for each country . The size of the links stands for the
volume of trade between any two countries. Colors give the regional respectively
memberships in different trade organisations: EC countries (yellow), EFTA
countries (green), USA and Canada (blue), Japan (red), East Asian Countries
(pink), Oceania (Australia , New Zealand) (black).
1981
http://www.mpi-fg-koeln.mpg.de/~lk/netvis/trade/WorldTrade.html
Social Network Visualization
•
Social Network Analysis
•
Is
obesity contagious
?
Revisting Subway Maps
•
Are they graphs or maps?
3 Subway Diagrams
•
Geographic landmarks largely suppressed on
maps, except water (rivers in Paris, London)
and asphalt (highways in Atlanta)
▫
Rather fitting, no?
•
These are more graphs than maps!
Really Cool Subway Map Exhibit
I saw this at
VisWeek 2011
•
Collection of
maps of
subways over
the years.
•
Here are a
few less
common
ones.
More Flow/Travel Graphs
•
Show path, another example of almost if not a
map application.
Airline flights
Visual Analytics on Networks
•
Social Networks (tools for Facebook, twitter,
etc)
•
Political Networks. Policital voting record
clustering (like Touchgraph)
Challenge
•
Senators (Touchgraph example)
▫
Party afflilation
▫
Religious association
•
Political Action Companies (PACs)
•
Networks
▫
Senators co-sponsoring bills (# per year)
▫
PACs support of senators ($$ per year)
•
How would you visualize?
TouchGraph
www.touchgraph.com
Action Science Explorer
•
Webpage
•
Literature linkage exploration. (watch video
starting at 2:40 to 3:30 to see automatic
grouping)
Many Examples
http://www.visualcomplexity.com
Visual Complexity Two Examples
•
Seattle Bands
•
Global Dependency Explorer
(view in Chrome)
Big Graphs
•
20,000 - 1,000,000 Nodes
•
Works well with 50,000
•
Projects
▫
Software Engineering
▫
Web site analysis
▫
Large database correlation
▫
Telephone fraud detection
▫
All Email traffic
Interaction
•
One of the key ways we move beyond graph
layout to graph visualization
•
(InfoVis) is interaction with the graph
MoireGraph
•
Uses radial layout not terribly unlike
hyperbolic tree, but no hyperbolic geometry
•
Impose levels on graph by doing min span tree
from some node
•
Put root at center, nodes at subsequent levels
further out radially, with descreasing space for
each
•
Interaction is key
Jankun-Kelly & Ma
InfoVis ‘03
Navigation and interaction…
Focus of Graph
•
Particular node may be focus, often placed in
center for circular layout
•
How does one build an interactive system that
allows changes in focus?
▫
Use animation
▫
But intuition about changes not always right
Recent Trends in GraphViz
•
Attributes of nodes influence geometric
positioning
▫
Not just some arbitrary layout
•
Utilize graph statistical analysis too
•
Largely driven by interest in social network
analysis
Vizster
•
Visualize social networking sites like
friendster, myspace, facebook
•
Implementation
▫
crawled 1.5 million members (Winter 2003)
▫
written in Java using the
prefuse tookit
(
http://prefuse.sourceforge.net)
•
Oppose Shneiderman’s mantra. Instead:
▫
“Start with what you know, then grow.”
Heer & boyd
InfoVis ‘05
Visualization
SocialAction
•
Combines graph structural analysis (ranking)
with interactive visual exploration
•
Multiple coordinated views
▫
Lists by ranking for analysis data
▫
Basic force-directed layout for graph vis
Perer & Shneiderman
TVCG ‘06
Do a Design
•
Design interface for
▫
Social network (facebook)
▫
Shared communications (twitter)
▫
Scholarly publications
Graph Drawing Resources
•
Book
▫
Di Battista, Eades, Tamassia, and Tollis,
Graph Drawing: Algorithms for the Visualization
of Graphs, Prentice Hall, 1999
•
Tutorial (talk slides)
▫
http://www.cs.brown.edu/people/rt/papers/gd
-tutorial/gd-constraints.pdf
•
Web links
▫
http://graphdrawing.org
▫
http://www.graphviz.org
Graph Drawing Uses
•
Many domains and data sets can benefit
significantly from nice graph drawings
•
Let’s look at some examples…
The concepts of network and tree graphs, including their definitions and uses, in this informative presentation. Learn about the differences between graphs and networks and how trees are a specialized subset. Discover examples and applications of tree hierarchies in various fields.

Download Presentation

Please find below an Image/Link to download the presentation.
The content on the website is provided AS IS for your information and personal use only. It may not be sold, licensed, or shared on other websites without obtaining consent from the author.If you encounter any issues during the download, it is possible that the publisher has removed the file from their server.
You are allowed to download the files provided on this website for personal or commercial use, subject to the condition that they are used lawfully. All files are the property of their respective owners.
The content on the website is provided AS IS for your information and personal use only. It may not be sold, licensed, or shared on other websites without obtaining consent from the author.
E N D
Presentation Transcript
UNC Examples for in class Visual Web Touchgraph Amazon>Movies Redford , Streep Try one Viszter
UNC Graphs, Networks, Trees The two terms "graph" and "network" are both used in several different ways. Following Dave Winer, the term "graph" is used to refer to (amongst other things): a visual representation of the variation of one variable in comparison with that of one or more other variables a mathematical concept of a set of nodes connected by links called edges a data structure based on that mathematical concept The term "network" is also used in several ways, including: an interconnected system of things (inanimate objects or people) a specialized type of graph (the mathematical concept) Trees are subsets of graphs/networks.
UNC Trees are Limited Version of Graphs Subcase of general graph No cycles Typically directed edges Special designated root vertex
UNC Tree Hierarchies in the World Pervasive Family histories, ancestries File/directory systems on computers Organization charts Animal kingdom: Phylum, , genus, Object-oriented software classes ...
UNC Trees Hierarchies often represented as trees Directed, acyclic graph Two main representation schemes Node-link Space-filling
UNC Node-Link Representations
UNC Node-Link Diagrams Root at top, leaves at bottom is very common
UNC Sample Representation From: Johnson & Shneiderman, 91
UNC Examples Good for Search Bad for Understanding Structure
UNC Why Put Root at Top? Root can be at center with levels growing outward too Can any node be the root?
UNC Drawing a Tree How does one draw this? DFS Percolate requirements upward
UNC Potential Problems For top-down, width of fan-out uses up horizontal real estate very quickly At level n, there are 2n nodes Tree might grow a lot along one particular branch Hard to draw it well in view without knowing how it will branch
UNC InfoVis Solutions Techniques developed in Information Visualization largely try to assist the problems identified in the last slide Alternatively, Information Visualization techniques attempt to show more attributes of data cases in hierarchy or focus on particular applications of trees
UNC SpaceTree Uses conventional 2D layout techniques with some clever additions Grosjean, Plaisant, Bederson InfoVis 02
UNC Characteristics Vertical or horizontal Subtrees are triangles Size indicates depth Shading indicates number of nodes inside Navigate by clicking on nodes Strongly restrict zooming
UNC Design Features Make labels readable Maximize number of levels opened Decompose tree animation Use landmarks Use overview and dynamic filtering
UNC 3D Approaches Add a third dimension into which layout can go Compromise of top-down and centered techniques mentioned earlier Children of a node are laid out in a cylinder below the parent Siblings live in one of the 2D planes
UNC Cone Trees Developed at Xerox PARC 3D views of hierarchies such as file systems Robertson, Mackinlay, Card CHI 91
UNC Alternate Views
UNC Cone Trees Positive More space available to lay out tree Aesthetically pleasing (?) Negative As in all 3D, occlusion obscures some nodes Is it really more efficient? For what tasks/users/contexts?
UNC Hyperbolic Browser Example: BlogWorld (YouTube video) Focus + Context Technique Detailed view blended with a global view First lay out the hierarchy on the hyperbolic plane Then map this plane to a disk Start with the tree s root at the center Use animation to navigate along this representation of the plane Lamping and Rao, JVLC 96
UNC 2D Hyperbolic Browser Approach: Lay out the hierarchy on the hyperbolic plane and map this plane onto a display region. Comparison A standard 2D browser 100 nodes (w/3 character text strings) Hyperbolic browser 1000 nodes, about 50 nearest the focus can show from 3 to dozens of characters
UNC Clicking on the blue node brings it into focus at the center
UNC Key Attributes Natural magnification (fisheye) in center Layout depends only on 2-3 generations from current node Smooth animation for change in focus Don t draw objects when far enough from root (simplify rendering)
UNC Problems Orientation Watching the view can be disorienting When a node is moved, its children don t keep their relative orientation to it as in Euclidean plane, they rotate Not as symmetric and regular as Euclidean techniques, two important attributes in aesthetics
UNC Performance Handle much larger graphs, i.e. >100,000 edges Support dynamic exploration & interactive browsing Maintain a guaranteed frame rate Example code base (javascript): Hypetree.js
UNC How about 3D? Can same hyperbolic transformation be applied, but now use 3D space? Munzner, IEEE CG&A 98
UNC Old School After all the interest in 3D and hyperbolic techniques in the 90 s, recently, there has been renewed interest in the old 2D methods (just done better) SpaceTree presented earlier Next 3 papers
UNC Degree-of-Interest Trees Problem Trees quickly degrade into line (example below) Approach Use fisheye-like focus & context ideas to control how a tree is drawn
UNC Approach Combine multiple ideas Expanded DOI computation Logical filtering to elide nodes Geometric scaling Semantic scaling Clustered representation of large unexpended branches Animated transition
UNC Example Operations
UNC Compression For nodes: compress to fit (compress in X or in Y) Within-node compression Data deletion Word abbreviation Node rotation
UNC Better View of Org Chart
UNC FlexTree Horizontally-drawn tree with compression along vertical dimension One focus is on showing decision trees well Contextual multi-foci view Basic idea: Push all nodes down as far as you can Song, Curran & Sterritt Information Visualization 04
UNC Example
UNC Bar Chart and Partial Views
UNC Node-link Shortcomings Difficult to encode more variables of data cases (nodes) Shape Color Size but all quickly clash with basic node-link structure
UNC Space-Filling Representations Each item occupies an area Children are contained under parent
UNC Treemap Space-filling representation developed by Shneiderman and Johnson, Vis 91 Children are drawn inside their parent Alternate horizontal and vertical slicing at each successive level Use area to encode other variable of data items
UNC Example
UNC Example
UNC Example
UNC Treemap? http://blog.wired.com/wiredscience/2008/06/awesome-infogra.html
UNC Treemap Affordances Good representation of two attributes beyond node-link: color and area Not as good at representing structure What happens if it s a perfectly balanced tree of items all the same size? Also can get long-thin aspect ratios Borders help on smaller trees, but take up too much area on large, deep ones
UNC Aspect ratios
UNC Early Treemap Applied to File System
UNC A Good Use of TreeMaps and Interactivity www.smartmoney.com/marketmap
UNC Treemaps in Peets site
UNC News Stories http://newsmap.jp/