Introduction to Experimental Studies
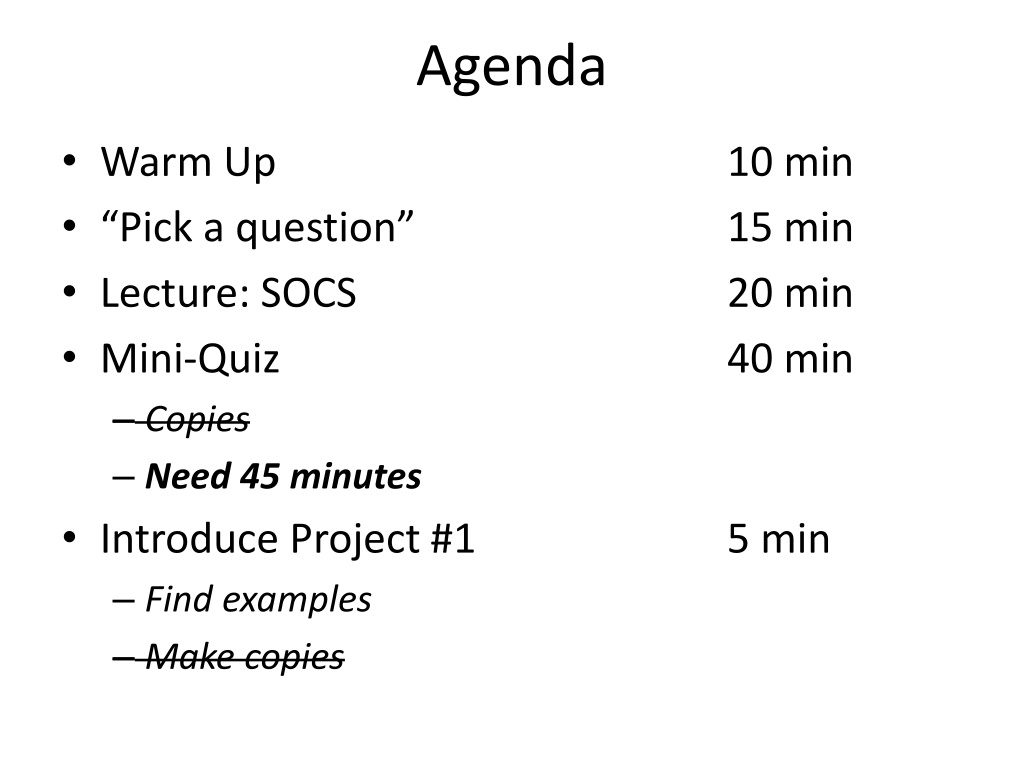

Agenda
•
Warm Up
10 min
•
“Pick a question”
15 min
•
Lecture: SOCS
20 min
•
Mini-Quiz
40 min
–
Copies
–
Need 45 minutes
•
Introduce Project #1
5 min
–
Find examples
–
Make copies
Warm Up
Let’s say I want to determine if a certain plant,
Plantus Madeupus
,
grows more quickly in Sacramento compared to Lake Tahoe.
Classify each of the following as a survey, observational study, or
experiment. Briefly justify your answer.
1.
I find a specimen of this plant in Sacramento and another
specimen of this plant in Lake Tahoe. I compare their growth
rates over the next year.
2.
I have two specimens of this plant. I put one in Sacramento and
another in Lake Tahoe. I compare their growth rates over the
next year.
3.
I ask a sample of experts whether they think this plant grows
more quickly in Sacramento or Lake Tahoe.
Do you understand?
How would you answer this question?
S
urvey
O
bservational study
E
xperiment
1.
What percentage of high school students know the name of
our current vice president?
4. Is smoking bad for you?
2. Is global warming really happening?
3. Do people think global warming is really happening?
EXAMPLE. Do men have better navigational abilities than women?
Whiteboards
“Pick a Question”
•
Choose a question from the list (next slide), and
brainstorm the following:
1.
Which
would you do?
–
Survey
,
observational study
, or
experiment
2.
How
?
Give details (briefly)
–
Survey
Who will you ask? What will you say?
–
Observational
How will you observe but not influence?
–
Experiment
What/who will you manipulate? How will
you keep everything else the same?
Whiteboards
1.
Make up your own question. (or choose from below)
2.
Who will win the 2020 presidential election?
3.
Do high school students prefer Coke or Pepsi?
4.
Does students with Macs have higher grades?
5.
How many hours a week do students spend on a computer?
6.
Does more Facebook friends mean more real friends?
7.
Does alcohol make you worse at driving?
8.
What is the most popular restaurant in West Sacramento?
9.
Are teenagers worse at driving than everyone else?
10.
Do people commit more crimes when it’s hotter outside?
11.
Does perfume/cologne make people more attractive?
12.
Does Vitamin C help cure a cold?
13.
Are blondes less intelligent?
How
?
Give details (briefly)
Survey
Who will you ask? What will you say?
Observ.
How will you observe but not influence?
Experiment
What/who will you manipulate?
How will you keep everything else the same?
“Pick a Question”
Whiteboard
“Pick a Question”
•
Survey
Who will you ask? What will you say
•
Observational
How will you observe without influencing?
•
Experiment
What will you manipulate? How will
everything else stay the same?
1.
Share with your partner.
2.
Two strengths in your partner’s design.
3.
Two flaws in your partner’s design.
Commenting on Data
SOCS
Brown strawberries….gross.
Scientists at a university want to determine whether a preservative was
effective in reducing discoloration in frozen strawberries. A sample of 50
ripe strawberries is prepared for freezing. Then the sample is randomly
divided into two groups of 25 strawberries each. The strawberries in the
treatment group are sprayed with a preservative, then all the
strawberries are placed in individual plastic bags. All bags are put in a
freezer for 6 months, then thawed. Each strawberries discoloration is
rated from 1 to 10, with a low score indicating little discoloration.
Based on the dotplots, comment on the effectiveness of the preservative
in lowering the amount of discoloration in strawberries.
“Comment”
•
When you are asked to “comment on”
(or
“describe” or “compare”)
a distribution, think:
S
O
C
S
hape
utliers
enter
pread
Notes
1 of 5
“Comment” on a display
•
Shape
(1 of 4)
–
Symmetric vs. skewed
–
Bimodal (two peaks)
–
Uniform, clusters, gaps
–
Approximately normal
Notes
2 of 5
“Comment” on a display
•
Outliers
(2 of 4)
–
“An individual value that falls
outside the overall pattern”
–
1.5•IQR (
next week
)
•
BUT just use your judgment
•
What is an example of a set of data that might have outliers?
Notes
3 of 5
•
Center
(3 of 4)
–
Median
–
Mean
W.
If a distribution is skewed left, compare
the median and mean. Which is larger?
D.
What is an example of a set of data that
might be skewed right?
“Comment” on a display
Notes
4 of 5
•
Spread
(4 of 4)
“Comment” on a display
Notes
5 of 5
Free-response #1, 2007
Few points
Treament
Roughly symmetric
No outliers
Mean = 5
More spread
Control
Skewed left
No outliers
Median = 7
Less spread
Most points
The treatment group is symmetric, while the control
group is skewed left. Neither group has any outliers. The
treatment group has a lower median discoloration rating
of approximately 5, while the control group has a higher
median discoloration rating of approximately 7. The
treatment group also seems more spread out than the
control group.
Full points
The treatment group is roughly symmetric, while the control
group is skewed left. Neither group has any obvious outliers.
The treatment group has a lower median discoloration rating
of approximately 5, while the control group has a higher
median discoloration rating of approximately 7. The treatment
group also seems more spread out than the control group.
This treatment apparently results in less discoloration of
frozen strawberries.
Full points
The treatment group is
roughly
symmetric, while the control
group is skewed left. Neither group has any
obvious
outliers.
The treatment group has a lower median discoloration rating
of approximately 5, while the control group has a higher
median discoloration rating of approximately 7. The treatment
group also seems more spread out than the control group.
This treatment apparently results in less discoloration of
frozen strawberries.
In Fall 2017, Gabby Baba asked a random
sample of RCHS students, “How many people
have you kissed?” These were the results:
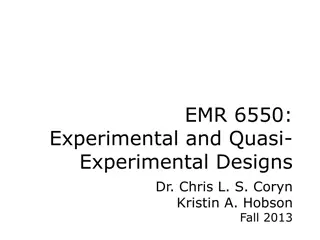
In Fall 2017, Jessika Garcia asked a random
sample of RCHS students, “On average, how
long does it take you to finish your makeup?”
These were the results:
How many people have you kissed?
On average, how long does it take you
to finish your makeup?
Mini-Quiz (¼ of Test)
•
Put away whiteboards. Separate desks.
•
You will need: pencil, eraser, calculator.
•
WHEN YOU ARE DONE:
–
Check your work. Don’t leave anything blank!
–
Write an “Expected Score”.
–
Raise your hand, I will come collect your quiz.
–
After I collect your exam, you may use your phone.
–
Please be
silent
for your classmates.
+1 point for correct
score guess
9 M.C., 1 pt each
1 FRQ, 9 pts
Project #1 (AP):
“Exploring Quantitative Data”
•
28 points in
Projects
grade
•
Due Tuesday 1/21
•
Collect and use any quantitative data
•
Sample projects by door
•
You are responsible for reading the assignment
handout, especially the rubrics.
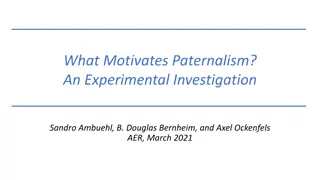
Dive into the world of research methods with a focus on surveys, observational studies, and experiments. Explore the nuances of designing and conducting each type of study, and learn how to classify and justify research approaches based on specific scenarios. Engage in critical thinking and decision-making while brainstorming potential research questions and methods.

Uploaded on Feb 18, 2025 | 0 Views
Download Presentation

Please find below an Image/Link to download the presentation.
The content on the website is provided AS IS for your information and personal use only. It may not be sold, licensed, or shared on other websites without obtaining consent from the author.If you encounter any issues during the download, it is possible that the publisher has removed the file from their server.
You are allowed to download the files provided on this website for personal or commercial use, subject to the condition that they are used lawfully. All files are the property of their respective owners.
The content on the website is provided AS IS for your information and personal use only. It may not be sold, licensed, or shared on other websites without obtaining consent from the author.
E N D
Presentation Transcript
Agenda Warm Up Pick a question Lecture: SOCS Mini-Quiz Copies Need 45 minutes Introduce Project #1 Find examples Make copies 10 min 15 min 20 min 40 min 5 min
Warm Up Let s say I want to determine if a certain plant, Plantus Madeupus, grows more quickly in Sacramento compared to Lake Tahoe. Classify each of the following as a survey, observational study, or experiment. Briefly justify your answer. 1. I find a specimen of this plant in Sacramento and another specimen of this plant in Lake Tahoe. I compare their growth rates over the next year. 2. I have two specimens of this plant. I put one in Sacramento and another in Lake Tahoe. I compare their growth rates over the next year. 3. I ask a sample of experts whether they think this plant grows more quickly in Sacramento or Lake Tahoe.
Whiteboards Do you understand? How would you answer this question? Survey Observational study Experiment EXAMPLE. Do men have better navigational abilities than women? 1. What percentage of high school students know the name of our current vice president? 2. Is global warming really happening? 3. Do people think global warming is really happening? 4. Is smoking bad for you?
Whiteboards Pick a Question Choose a question from the list (next slide), and brainstorm the following: 1. Which would you do? Survey, observational study, or experiment 2. How? Give details (briefly) Survey Who will you ask? What will you say? Observational How will you observe but not influence? Experiment What/who will you manipulate? How will you keep everything else the same?
Pick a Question Whiteboard 1. 2. 3. 4. 5. 6. 7. 8. 9. 10. Do people commit more crimes when it s hotter outside? 11. Does perfume/cologne make people more attractive? 12. Does Vitamin C help cure a cold? 13. Are blondes less intelligent? How? Give details (briefly) Survey Who will you ask? What will you say? Observ. How will you observe but not influence? Experiment What/who will you manipulate? How will you keep everything else the same? Make up your own question. (or choose from below) Who will win the 2020 presidential election? Do high school students prefer Coke or Pepsi? Does students with Macs have higher grades? How many hours a week do students spend on a computer? Does more Facebook friends mean more real friends? Does alcohol make you worse at driving? What is the most popular restaurant in West Sacramento? Are teenagers worse at driving than everyone else?
Pick a Question Survey Who will you ask? What will you say Observational How will you observe without influencing? Experiment What will you manipulate? How will everything else stay the same? 1. Share with your partner. 2. Two strengths in your partner s design. 3. Two flaws in your partner s design.
Commenting on Data SOCS
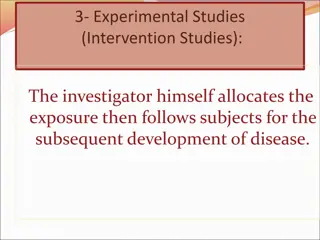
Brown strawberries.gross. Scientists at a university want to determine whether a preservative was effective in reducing discoloration in frozen strawberries. A sample of 50 ripe strawberries is prepared for freezing. Then the sample is randomly divided into two groups of 25 strawberries each. The strawberries in the treatment group are sprayed with a preservative, then all the strawberries are placed in individual plastic bags. All bags are put in a freezer for 6 months, then thawed. Each strawberries discoloration is rated from 1 to 10, with a low score indicating little discoloration. Based on the dotplots, comment on the effectiveness of the preservative in lowering the amount of discoloration in strawberries.
Notes 1 of 5 Comment When you are asked to comment on (or describe or compare ) a distribution, think: S O C S pread hape Leave space (~1 ) for notes between each utliers enter
Notes 2 of 5 Comment on a display Shape (1 of 4) Symmetric vs. skewed Bimodal (two peaks) Uniform, clusters, gaps Approximately normal Skewed right Skewed left
Notes 3 of 5 Comment on a display Outliers (2 of 4) An individual value that falls outside the overall pattern 1.5 IQR (next week) BUT just use your judgment What is an example of a set of data that might have outliers?
Notes 4 of 5 Comment on a display Center (3 of 4) Median Mean Skewed left W. If a distribution is skewed left, compare the median and mean. Which is larger? D. What is an example of a set of data that might be skewed right?
Notes 5 of 5 Comment on a display Spread (4 of 4)
Few points Treament Roughly symmetric No outliers Mean = 5 More spread Control Skewed left No outliers Median = 7 Less spread
Most points The treatment group is symmetric, while the control group is skewed left. Neither group has any outliers. The treatment group has a lower median discoloration rating of approximately 5, while the control group has a higher median discoloration rating of approximately 7. The treatment group also seems more spread out than the control group.
Full points The treatment group is roughly symmetric, while the control group is skewed left. Neither group has any obvious outliers. The treatment group has a lower median discoloration rating of approximately 5, while the control group has a higher median discoloration rating of approximately 7. The treatment group also seems more spread out than the control group. This treatment apparently results in less discoloration of frozen strawberries.
Full points The treatment group is roughly symmetric, while the control group is skewed left. Neither group has any obvious outliers. The treatment group has a lower median discoloration rating of approximately 5, while the control group has a higher median discoloration rating of approximately 7. The treatment group also seems more spread out than the control group. This treatment apparently results in less discoloration of frozen strawberries.
In Fall 2017, Gabby Baba asked a random sample of RCHS students, How many people have you kissed? These were the results: 0 0 0 0 0 0 0 1 1 1 1 2 2 2 3 3 3 4 4 4 5 11 17 18 24
In Fall 2017, Jessika Garcia asked a random sample of RCHS students, On average, how long does it take you to finish your makeup? These were the results: 0 3 5 5 10 15 15 15 15 15 20 25 30 30 30 35 45 45 45 60 60 90 150
On average, how long does it take you to finish your makeup?
Mini-Quiz ( of Test) Put away whiteboards. Separate desks. You will need: pencil, eraser, calculator. 9 M.C., 1 pt each 1 FRQ, 9 pts +1 point for correct score guess WHEN YOU ARE DONE: Check your work. Don t leave anything blank! Write an Expected Score . Raise your hand, I will come collect your quiz. After I collect your exam, you may use your phone. Please be silent for your classmates.
Project #1 (AP): Exploring Quantitative Data 28 points in Projects grade Due Tuesday 1/21 Collect and use any quantitative data Sample projects by door You are responsible for reading the assignment handout, especially the rubrics.


")
:")