International Economic Perspectives
I
n
t
e
r
n
a
t
i
o
n
a
l
E
c
o
n
o
m
i
c
P
e
r
s
p
e
c
t
i
v
e
s
P
A
N
D
E
M
I
C
E
C
O
N
O
M
I
C
S
C
H
A
P
T
E
R
1
2
PANDEMIC ECONOMICS 12
1
T
o
p
i
c
s
1.
The Impact of a Pandemic on the Global Economy
2.
Factors that Impact Global Economic Activity
3.
Pandemic Economy Tracker
4.
Model of a Trading Economy
5.
Economics of Developing Countries
PANDEMIC ECONOMICS 12
2
L
e
a
r
n
i
n
g
O
b
j
e
c
t
i
v
e
s
A
f
t
e
r
r
e
a
d
i
n
g
t
h
i
s
c
h
a
p
t
e
r
,
y
o
u
w
i
l
l
b
e
a
b
l
e
t
o
:
LO1
Explain how a pandemic impacts the global economy.
LO2
Analyze factors that impact economic activity, including the nature of the shock,
amplification channels, early indicators, and commodity prices.
LO3
Apply a pandemic economy tracker to assess the economic effects of a pandemic.
LO4
Use a model of a trading economy to demonstrate the international effects of economic
contraction.
LO5
Explain that a pandemic makes it difficult to achieve the goals of sustainable
development, including food security, poverty eradication, and peace.
LO6
Discuss the potential for lasting effects of a pandemic on the process of globalization
and networks of global exchange.
PANDEMIC ECONOMICS 10
3
1
.
T
h
e
I
m
p
a
c
t
o
f
a
P
a
n
d
e
m
i
c
o
n
t
h
e
G
l
o
b
a
l
E
c
o
n
o
m
y
•
To curb the spread of disease during a
pandemic, governing authorities in countries
around the world implement lockdown
measures, shut down businesses, and reduce
economic activity.
•
The results are higher levels of unemployment
from a national perspective and less economic
exchange from a global perspective.
•
Closing country borders, shuttering workplaces,
and limiting distribution in supply chains slow
much of the global economy.
PANDEMIC ECONOMICS 12
4
G
r
e
a
t
L
o
c
k
d
o
w
n
•
In the context of the coronavirus pandemic, the International
Monetary Fund (2020) calls country interventions the
Great Lockdown
:
The extensive measures that reduce disease contagion and save
lives.
•
When global shocks occur, such as pandemics, the economic
outcomes take years to unfold, often spiraling in unpredictable
directions.
PANDEMIC ECONOMICS 12
5
2
.
F
a
c
t
o
r
s
t
h
a
t
I
m
p
a
c
t
G
l
o
b
a
l
E
c
o
n
o
m
i
c
A
c
t
i
v
i
t
y
•
On a global scale, a pandemic creates public
health and economic costs.
•
The crisis in public health requires a reduction
in global economic activity.
•
According to the IMF (2020), several factors
signal the severity of a global shock, including
the nature of the shock, amplification channels,
early indicators, and changes in commodity
prices.
PANDEMIC ECONOMICS 12
6
NATURE OF THE SHOCK
The nature of the shock determines
the length and severity of the global
economic downturn.
AMPLIFICATION CHANNELS
The shock associated with a global
pandemic amplifies through familiar
channels.
PANDEMIC ECONOMICS 12
7
EARLY INDICATORS
Early indicators warn of future
economic disruptions.
COMMODITY PRICES
The deterioration of economic
conditions leads to a decline in
commodity prices.
PANDEMIC ECONOMICS 12
8
3
.
P
a
n
d
e
m
i
c
E
c
o
n
o
m
y
T
r
a
c
k
e
r
•
During a pandemic, tracking the global
economy reveals both economic trends
and the potential for correlation between
economic variables.
•
Several variables inform a pandemic
economy tracker:
•
Mobility and economic performance
•
Speed of intervention
•
Size of the economy
•
Capital markets
•
Developing country status
PANDEMIC ECONOMICS 12
9
MOBILITY AND ECONOMIC PERFORMANCE
The loss of mobility relates to changes
in economic activity.
SPEED OF INTERVENTION
The more extensive, decisive, and
expedient are intervention policies,
the slower is the spread of infections.
PANDEMIC ECONOMICS 12
10
SIZE OF ECONOMY
Using business cycle terminology, the
contractionary interval is brief for
some countries and longer for others.
CAPITAL MARKETS
Intervention policies lead to economic
contraction. The reaction of capital
markets reveals market expectations.
PANDEMIC ECONOMICS 12
11
DEVELOPING COUNTRY STATUS
Countries may struggle through
subsequent infection waves if they
allocate fewer resources to identify,
track, and isolate infections.
PANDEMIC ECONOMICS 12
12
4
.
M
o
d
e
l
o
f
a
T
r
a
d
i
n
g
E
c
o
n
o
m
y
•
The model of a trading economy by Krugman et
al. (2018) demonstrates the impact of economic
contraction.
•
It uses several relationships:
•
Production possibilities and supply
•
Relative prices and demand
•
Terms of trade and country welfare
•
Relative supply, relative demand, and global
equilibrium
•
Contraction and the production possibility frontier
PANDEMIC ECONOMICS 12
13
P
r
o
d
u
c
t
i
o
n
P
o
s
s
i
b
i
l
i
t
i
e
s
a
n
d
S
u
p
p
l
y
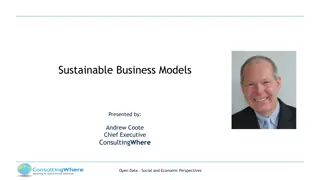
•
Assume trade between two countries.
•
Each country produces two forms of output, goods (
G
) and services (
S
).
•
Each possesses a
production possibility frontier
(PPF), which demonstrates the
maximum level of production, given current economic resources and
technology.
PANDEMIC ECONOMICS 12
14
PANDEMIC ECONOMICS 12
15
P
r
o
d
u
c
t
i
o
n
a
n
d
I
s
o
v
a
l
u
e
L
i
n
e
s
•
Production depends on the ratio of the price of services (
P
S
) to goods (
P
G
):
P
S
/
P
G
•
In the absence of external effects, market power, and other forms of market
failure, an efficient economy maximizes the value of output:
P
S
Q
S
+
P
G
Q
G
•
Along
isovalue lines
, the value of output is constant:
V
=
P
S
Q
S
+
P
G
Q
G
•
But when
V
increases, the isovalue line shifts away from the origin:
(
V
2
>
V
1
>
V
0
)
PANDEMIC ECONOMICS 12
16
C
a
s
e
O
n
e
:
F
u
l
l
E
m
p
l
o
y
m
e
n
t
P
r
o
d
u
c
t
i
o
n
•
A change in relative prices leads to two outcomes.
•
It alters the slope of the isovalue line and determines a new production bundle.
•
Suppose
P
S
/
P
G
rises, increasing the slope of
V
1
.
PANDEMIC ECONOMICS 12
17
PANDEMIC ECONOMICS 12
18
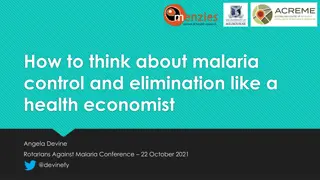
•
The new isovalue line
(
V
1
1
) moves the
production bundle from
point
a
to point
b
.
•
As the relative price of
services increases, the
economy produces more
services and fewer goods.
R
e
l
a
t
i
v
e
P
r
i
c
e
s
a
n
d
D
e
m
a
n
d
•
The value of an economy’s production equals the value of its consumption:
V
=
P
S
Q
S
+
P
G
Q
G
=
P
S
D
S
+
P
G
D
G
,
where
D
S
and
D
G
represent the consumption of services and goods
•
Consumption and production lie on the same isovalue line.
•
Consumption depends on consumer tastes and preferences, which are
represented by
indifference curves
(
I
1
…, I
n
).
•
Along an indifference curve, the consumption of goods and services leaves
consumers equally well off.
PANDEMIC ECONOMICS 12
19
PANDEMIC ECONOMICS 12
20
•
T
he economy maximizes
welfare and consumes at
point
c
, where the isovalue
line is tangent to
I
1
.
•
The economy produces at
point
a
and consumes at
point
c
•
The economy exports
services (measured along
the horizontal axis) and
imports goods (measured
along the vertical axis).
T
e
r
m
s
o
f
T
r
a
d
e
a
n
d
C
o
u
n
t
r
y
W
e
l
f
a
r
e
•
A different
terms of trade
, defined as the price of an item that the economy
exports divided by the price of the item the economy imports, alters the welfare
effects.
•
While the economy is exporting services and importing goods, suppose
P
S
/
P
G
increases.
•
This change in relative prices improves the economy’s competitive position.
PANDEMIC ECONOMICS 12
21
PANDEMIC ECONOMICS 12
22
•
When
P
S
/
P
G
increases,
V
1
rotates to
V
1
1
.
•
An increase in the terms
of trade raises the
economy’s welfare.
•
When
P
S
/
P
G
increases,
the economy moves from
point
c
to point
d
on a
higher indifference curve
(
I
2
).
G
l
o
b
a
l
E
q
u
i
l
i
b
r
i
u
m
•
The determination of an equilibrium depends on global relative supply (
RS
) and
global relative demand (
RD
).
•
Suppose a home economy and a foreign economy.
•
The home economy exports services and the foreign economy exports goods.
PANDEMIC ECONOMICS 12
23
P
r
o
d
u
c
t
i
o
n
a
n
d
T
e
r
m
s
o
f
T
r
a
d
e
•
The production of goods and services by the home economy is represented by
Q
G
and
Q
S
, respectively.
•
The terms of trade
P
S
/
P
G
applies to the home economy.
•
The production of good and services in the foreign economy is represented by
Q
G
*
and
Q
S
*
, respectively.
•
The terms of trade
P
G
/
P
S
applies to the foreign economy.
•
The global relative supply of and relative demand for services determines both
the terms of trade,
P
S
/
P
G
,
and the relative quantity of services (
RQS
):
Q
S
+
Q
S
*
/
Q
G
+
Q
G
*
PANDEMIC ECONOMICS 12
24
G
l
o
b
a
l
R
e
l
a
t
i
v
e
S
u
p
p
l
y
a
n
d
D
e
m
a
n
d
•
The
RS
curve slopes upward because an increase in
P
S
/
P
G
encourages suppliers
to produce more.
•
The
RD
curve slopes downward because an increase in
P
S
/
P
G
encourages
consumers to alter their consumption mix with more goods and less services.
•
The key in the analysis is that shifts in
RS
may show a bias toward goods or
services:
•
Rightward shift in
RS
: service-biased growth (more services relative to goods)
•
Leftward shift in
RS
: goods-biased growth (more goods relative to services)
PANDEMIC ECONOMICS 12
25
PANDEMIC ECONOMICS 12
26
C
a
s
e
T
w
o
:
R
e
c
e
s
s
i
o
n
D
u
r
i
n
g
a
P
a
n
d
e
m
i
c
•
A global recession reduces economic activity but is not evenly
distributed.
•
In the model, a difference between goods and services alters the
composition of production.
PANDEMIC ECONOMICS 12
27
C
o
n
t
r
a
c
t
i
o
n
a
n
d
t
h
e
P
P
F
•
During a global recession, one possibility is that the supply of all forms of
output declines equally so that the relative quantity of services to goods
remains constant.
•
Another possibility, relevant for a pandemic, is that a global recession
demonstrates
biased contraction
toward goods.
•
That is, the supply of services may decline, but the supply of goods declines
even more.
PANDEMIC ECONOMICS 12
28
PANDEMIC ECONOMICS 12
29
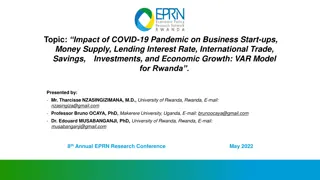
•
The PPF shifts inward
more in one direction
(goods) than the other
(services).
•
The economy operates
on a lower isovalue line
(
V
0
) and the production
bundle moves from point
a
to point
e
.
R
e
l
a
t
i
v
e
S
u
p
p
l
y
a
n
d
t
h
e
T
e
r
m
s
o
f
T
r
a
d
e
•
Suppose the home economy experiences biased contraction toward
goods, so its production of goods decreases relatively more than its
production of services.
•
For the global economy, the production of services relative to goods
rises.
PANDEMIC ECONOMICS 12
30
PANDEMIC ECONOMICS 12
31
•
The global relative supply
curve shifts to the right from
RS
1
to
RS
2
, decreasing the
relative price of services
from
(P
S
/
P
G
)
1
to
(P
S
/
P
G
)
2
and
increasing the relative
quantity of services from
RQS
1
to
RQS
2
.
•
This
import-biased
contraction
reduces an
economy’s ability to import
goods, which may
exacerbate shortages during
a pandemic.
5
.
E
c
o
n
o
m
i
c
s
o
f
D
e
v
e
l
o
p
i
n
g
C
o
u
n
t
r
i
e
s
•
The study of
development economics
addresses
the efficient allocation of scarce or idle
resources and the economic, institutional, and
social mechanisms, private and public, necessary
to bring about improvements in human well-
being.
•
A focus on developing economies makes clear
that the effects of a global pandemic are not
equally distributed.
PANDEMIC ECONOMICS 12
32
W
o
r
l
d
B
a
n
k
I
n
c
o
m
e
C
l
a
s
s
i
f
i
c
a
t
i
o
n
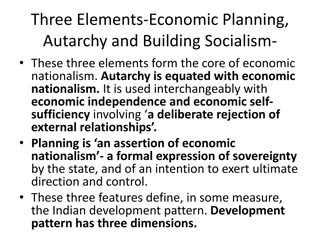
•
The World Bank, an international financial institution that provides grants and
loans, uses data on gross national income per capita in current U.S. dollars to
classify economies according to four income groups:
•
high income
•
upper-middle income
•
lower-middle income
•
low income
•
Economies in classifications other than high income are considered developing.
PANDEMIC ECONOMICS 12
33
PANDEMIC ECONOMICS 12
34
C
h
a
r
a
c
t
e
r
i
s
t
i
c
s
o
f
D
e
v
e
l
o
p
i
n
g
C
o
u
n
t
r
i
e
s
•
Developing countries possess a range of characteristics with economic activity,
social structure, language, tradition, history, culture, and political systems.
•
While the characteristics may differ by degree, they exist as reasons why the
status of “developing” persists.
•
Characteristics of developing countries include:
•
relatively lower living standards
•
lower levels of productivity
•
higher rates of population growth and dependency burden
•
greater percentage of work in the informal sector
•
dependence and vulnerability in international relations
PANDEMIC ECONOMICS 12
35
I
m
p
a
c
t
o
f
a
P
a
n
d
e
m
i
c
o
n
D
e
v
e
l
o
p
i
n
g
C
o
u
n
t
r
i
e
s
•
Developing countries are in a difficult position to respond to a global shock.
•
Like developed countries, they suffer from economic contraction, lockdown
measures, and rising infections.
•
But lower living standards, lower levels of productivity, higher population
growth rates, large informal sectors, and relatively weaker positions in the global
economic order constrain the capacity of developing countries to address these
problems in a comprehensive manner.
PANDEMIC ECONOMICS 12
36
S
u
s
t
a
i
n
a
b
l
e
D
e
v
e
l
o
p
m
e
n
t
G
o
a
l
s
The goals of sustainable development, established by the United
Nations in 2015 as a collection of interdependent aspirations and
made actionable in 2017, are designed as a blueprint for a more
sustainable future.
PANDEMIC ECONOMICS 12
37
PANDEMIC ECONOMICS 12
38
The impact of a pandemic on the global economy, factors influencing economic activity, pandemic economy tracker, trading economy model, and the challenges in achieving sustainable development goals amidst a pandemic. Learn about the lasting effects on globalization and global exchange networks.

Uploaded on Feb 15, 2025 | 0 Views
Download Presentation

Please find below an Image/Link to download the presentation.
The content on the website is provided AS IS for your information and personal use only. It may not be sold, licensed, or shared on other websites without obtaining consent from the author.If you encounter any issues during the download, it is possible that the publisher has removed the file from their server.
You are allowed to download the files provided on this website for personal or commercial use, subject to the condition that they are used lawfully. All files are the property of their respective owners.
The content on the website is provided AS IS for your information and personal use only. It may not be sold, licensed, or shared on other websites without obtaining consent from the author.
E N D
Presentation Transcript
International Economic International Economic Perspectives Perspectives PANDEMIC ECONOMICS PANDEMIC ECONOMICS CHAPTER 12 CHAPTER 12 1 PANDEMIC ECONOMICS 12
Topics Topics 1. The Impact of a Pandemic on the Global Economy 2. Factors that Impact Global Economic Activity 3. Pandemic Economy Tracker 4. Model of a Trading Economy 5. Economics of Developing Countries 2 PANDEMIC ECONOMICS 12
Learning Objectives Learning Objectives After reading this chapter, you will be able to: After reading this chapter, you will be able to: LO1 Explain how a pandemic impacts the global economy. LO2 Analyze factors that impact economic activity, including the nature of the shock, amplification channels, early indicators, and commodity prices. LO3 Apply a pandemic economy tracker to assess the economic effects of a pandemic. LO4 Use a model of a trading economy to demonstrate the international effects of economic contraction. LO5 Explain that a pandemic makes it difficult to achieve the goals of sustainable development, including food security, poverty eradication, and peace. LO6 Discuss the potential for lasting effects of a pandemic on the process of globalization and networks of global exchange. 3 PANDEMIC ECONOMICS 10
To curb the spread of disease during a pandemic, governing authorities in countries around the world implement lockdown measures, shut down businesses, and reduce economic activity. 1. The Impact 1. The Impact of a Pandemic of a Pandemic on the Global on the Global Economy Economy The results are higher levels of unemployment from a national perspective and less economic exchange from a global perspective. Closing country borders, shuttering workplaces, and limiting distribution in supply chains slow much of the global economy. 4 PANDEMIC ECONOMICS 12
Great Lockdown Great Lockdown In the context of the coronavirus pandemic, the International Monetary Fund (2020) calls country interventions the Great Lockdown: The extensive measures that reduce disease contagion and save lives. When global shocks occur, such as pandemics, the economic outcomes take years to unfold, often spiraling in unpredictable directions. 5 PANDEMIC ECONOMICS 12
On a global scale, a pandemic creates public health and economic costs. 2. Factors that 2. Factors that Impact Global Impact Global Economic Economic Activity Activity The crisis in public health requires a reduction in global economic activity. According to the IMF (2020), several factors signal the severity of a global shock, including the nature of the shock, amplification channels, early indicators, and changes in commodity prices. 6 PANDEMIC ECONOMICS 12
NATURE OF THE SHOCK AMPLIFICATION CHANNELS The nature of the shock determines the length and severity of the global economic downturn. The shock associated with a global pandemic amplifies through familiar channels. 7 PANDEMIC ECONOMICS 12
EARLY INDICATORS COMMODITY PRICES Early indicators warn of future economic disruptions. The deterioration of economic conditions leads to a decline in commodity prices. 8 PANDEMIC ECONOMICS 12
During a pandemic, tracking the global economy reveals both economic trends and the potential for correlation between economic variables. 3. Pandemic 3. Pandemic Economy Economy Tracker Tracker Several variables inform a pandemic economy tracker: Mobility and economic performance Speed of intervention Size of the economy Capital markets Developing country status 9 PANDEMIC ECONOMICS 12
MOBILITY AND ECONOMIC PERFORMANCE SPEED OF INTERVENTION The loss of mobility relates to changes in economic activity. The more extensive, decisive, and expedient are intervention policies, the slower is the spread of infections. 10 PANDEMIC ECONOMICS 12
SIZE OF ECONOMY CAPITAL MARKETS Using business cycle terminology, the contractionary interval is brief for some countries and longer for others. Intervention policies lead to economic contraction. The reaction of capital markets reveals market expectations. 11 PANDEMIC ECONOMICS 12
DEVELOPING COUNTRY STATUS Countries may struggle through subsequent infection waves if they allocate fewer resources to identify, track, and isolate infections. 12 PANDEMIC ECONOMICS 12
The model of a trading economy by Krugman et al. (2018) demonstrates the impact of economic contraction. 4. Model of a 4. Model of a Trading Trading Economy Economy It uses several relationships: Production possibilities and supply Relative prices and demand Terms of trade and country welfare Relative supply, relative demand, and global equilibrium Contraction and the production possibility frontier 13 PANDEMIC ECONOMICS 12
Production Possibilities and Supply Production Possibilities and Supply Assume trade between two countries. Each country produces two forms of output, goods (G) and services (S). Each possesses a production possibility frontier(PPF), which demonstrates the maximum level of production, given current economic resources and technology. 14 PANDEMIC ECONOMICS 12
15 PANDEMIC ECONOMICS 12
Production and Isovalue Lines Production and Isovalue Lines Production depends on the ratio of the price of services (PS) to goods (PG): PS/PG In the absence of external effects, market power, and other forms of market failure, an efficient economy maximizes the value of output: Along isovalue lines, the value of output is constant: PSQS + PGQG But when V increases, the isovalue line shifts away from the origin: V = PSQS + PGQG (V2 > V1 > V0) 16 PANDEMIC ECONOMICS 12
Case One: Full Employment Production Case One: Full Employment Production A change in relative prices leads to two outcomes. It alters the slope of the isovalue line and determines a new production bundle. Suppose PS/PG rises, increasing the slope of V1. 17 PANDEMIC ECONOMICS 12
The new isovalue line (V11) moves the production bundle from point a to point b. As the relative price of services increases, the economy produces more services and fewer goods. 18 PANDEMIC ECONOMICS 12
Relative Prices and Demand Relative Prices and Demand The value of an economy s production equals the value of its consumption: V = PSQS + PGQG = PSDS + PGDG, where DS and DG represent the consumption of services and goods Consumption and production lie on the same isovalue line. Consumption depends on consumer tastes and preferences, which are represented by indifference curves (I1 , In). Along an indifference curve, the consumption of goods and services leaves consumers equally well off. 19 PANDEMIC ECONOMICS 12
The economy maximizes welfare and consumes at point c, where the isovalue line is tangent to I1. The economy produces at point a and consumes at point c The economy exports services (measured along the horizontal axis) and imports goods (measured along the vertical axis). 20 PANDEMIC ECONOMICS 12
Terms of Trade and Country Welfare Terms of Trade and Country Welfare A different terms of trade, defined as the price of an item that the economy exports divided by the price of the item the economy imports, alters the welfare effects. While the economy is exporting services and importing goods, suppose PS/PG increases. This change in relative prices improves the economy s competitive position. 21 PANDEMIC ECONOMICS 12
When PS/PGincreases, V1 rotates to V11. An increase in the terms of trade raises the economy s welfare. When PS/PG increases, the economy moves from point c to point d on a higher indifference curve (I2). 22 PANDEMIC ECONOMICS 12
Global Equilibrium Global Equilibrium The determination of an equilibrium depends on global relative supply (RS) and global relative demand (RD). Suppose a home economy and a foreign economy. The home economy exports services and the foreign economy exports goods. 23 PANDEMIC ECONOMICS 12
Production and Terms of Trade Production and Terms of Trade The production of goods and services by the home economy is represented by QG and QS, respectively. The terms of trade PS/PG applies to the home economy. The production of good and services in the foreign economy is represented by QG* and QS*, respectively. The terms of trade PG/PS applies to the foreign economy. The global relative supply of and relative demand for services determines both the terms of trade, PS/PG, and the relative quantity of services (RQS): QS + QS*/QG + QG* 24 PANDEMIC ECONOMICS 12
Global Relative Supply and Demand Global Relative Supply and Demand The RS curve slopes upward because an increase in PS/PG encourages suppliers to produce more. The RD curve slopes downward because an increase in PS/PG encourages consumers to alter their consumption mix with more goods and less services. The key in the analysis is that shifts in RS may show a bias toward goods or services: Rightward shift in RS: service-biased growth (more services relative to goods) Leftward shift in RS: goods-biased growth (more goods relative to services) 25 PANDEMIC ECONOMICS 12
26 PANDEMIC ECONOMICS 12
Case Two: Recession During a Pandemic Case Two: Recession During a Pandemic A global recession reduces economic activity but is not evenly distributed. In the model, a difference between goods and services alters the composition of production. 27 PANDEMIC ECONOMICS 12
Contraction and the PPF Contraction and the PPF During a global recession, one possibility is that the supply of all forms of output declines equally so that the relative quantity of services to goods remains constant. Another possibility, relevant for a pandemic, is that a global recession demonstrates biased contractiontoward goods. That is, the supply of services may decline, but the supply of goods declines even more. 28 PANDEMIC ECONOMICS 12
The PPF shifts inward more in one direction (goods) than the other (services). The economy operates on a lower isovalue line (V0) and the production bundle moves from point a to point e. 29 PANDEMIC ECONOMICS 12
Relative Supply and the Terms of Trade Relative Supply and the Terms of Trade Suppose the home economy experiences biased contraction toward goods, so its production of goods decreases relatively more than its production of services. For the global economy, the production of services relative to goods rises. 30 PANDEMIC ECONOMICS 12
The global relative supply curve shifts to the right from RS1 to RS2, decreasing the relative price of services from (PS/PG)1 to (PS/PG)2 and increasing the relative quantity of services from RQS1 to RQS2. This import-biased contractionreduces an economy s ability to import goods, which may exacerbate shortages during a pandemic. 31 PANDEMIC ECONOMICS 12
The study of development economicsaddresses the efficient allocation of scarce or idle resources and the economic, institutional, and social mechanisms, private and public, necessary to bring about improvements in human well- being. 5. Economics 5. Economics of Developing of Developing Countries Countries A focus on developing economies makes clear that the effects of a global pandemic are not equally distributed. 32 PANDEMIC ECONOMICS 12
World Bank Income Classification World Bank Income Classification The World Bank, an international financial institution that provides grants and loans, uses data on gross national income per capita in current U.S. dollars to classify economies according to four income groups: high income upper-middle income lower-middle income low income Economies in classifications other than high income are considered developing. 33 PANDEMIC ECONOMICS 12
34 PANDEMIC ECONOMICS 12
Characteristics of Developing Countries Characteristics of Developing Countries Developing countries possess a range of characteristics with economic activity, social structure, language, tradition, history, culture, and political systems. While the characteristics may differ by degree, they exist as reasons why the status of developing persists. Characteristics of developing countries include: relatively lower living standards lower levels of productivity higher rates of population growth and dependency burden greater percentage of work in the informal sector dependence and vulnerability in international relations 35 PANDEMIC ECONOMICS 12
Impact of a Pandemic on Developing Countries Impact of a Pandemic on Developing Countries Developing countries are in a difficult position to respond to a global shock. Like developed countries, they suffer from economic contraction, lockdown measures, and rising infections. But lower living standards, lower levels of productivity, higher population growth rates, large informal sectors, and relatively weaker positions in the global economic order constrain the capacity of developing countries to address these problems in a comprehensive manner. 36 PANDEMIC ECONOMICS 12
Sustainable Development Goals Sustainable Development Goals The goals of sustainable development, established by the United Nations in 2015 as a collection of interdependent aspirations and made actionable in 2017, are designed as a blueprint for a more sustainable future. 37 PANDEMIC ECONOMICS 12
38 PANDEMIC ECONOMICS 12