Integrating Ecosystem Services into Economic Models: The Case of Invasive Alien Species
Explore the integration of ecosystems into economic models, with a focus on bridging existing tools, enlarging modules, and ad hoc integration. Learn about the rationale behind tool adoption, Europe's implementation of INCA for Natural Capital Accounting, and the assessment of Ecosystem Services.
Download Presentation

Please find below an Image/Link to download the presentation.
The content on the website is provided AS IS for your information and personal use only. It may not be sold, licensed, or shared on other websites without obtaining consent from the author.If you encounter any issues during the download, it is possible that the publisher has removed the file from their server.
You are allowed to download the files provided on this website for personal or commercial use, subject to the condition that they are used lawfully. All files are the property of their respective owners.
The content on the website is provided AS IS for your information and personal use only. It may not be sold, licensed, or shared on other websites without obtaining consent from the author.
E N D
Presentation Transcript
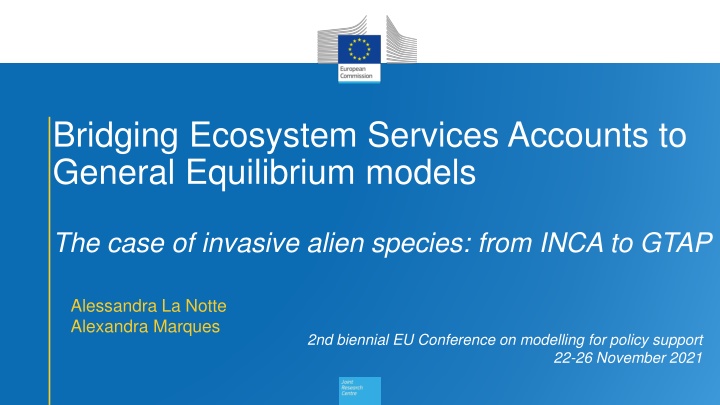
Bridging Ecosystem Services Accounts to General Equilibrium models The case of invasive alien species: from INCA to GTAP Alessandra La Notte Alexandra Marques 2nd biennial EU Conference on modelling for policy support 22-26 November 2021 1
How to integrate ecosystems into the economy Three options multiple use applicability discipline dominance 1- Bridging find a way to bridge existing set of models and tools in a consistent and coeherent way 2- Enlarging create specific modules in existing models/tool to addess specific issues 3- Ad hoc integration create ad hoc models meant to integrate selected environmental and economic variables to address specific policy issues 2
Rationale behind Option#1 Use tools that talk the same language and follow the same mechanisms to bridge current advanced knowledge supply table supply table use table Economic Unit Institutional sectors Economic Unit Ecosystem types Institutional sectors water collection,treatment,supply water collection,treatment,supply accomodation and food services accomodation and food services trasportation and storage trasportation and storage mining and quarrying mining and quarrying electricity, gas supply electricity, gas supply forest & woodland sparse vegetation heatland & shrub other industries other industries rivers and lakes manufacturing manufacturing construction construction households households agriculture agriculture grassland cropland fisheries fisheries wetland forestry forestry marine urban PRODUCTS ES ES use table Institutional sectors Economic Unit water collection,treatment,supply accomodation and food services trasportation and storage mining and quarrying electricity, gas supply other industries manufacturing construction households agriculture fisheries forestry Satellite accounts PRODUCTS 3
Is this tool acknowledged? Yes Officially adopted by the UN Statistical Commission in March 2021 Are we implementing this tool in Europe? Yes: Integrated system for Natural Capital Accounting (INCA) 4
The INCA implementation: Assessment of ES Supply and Use tables ET 1 ET 2 ... Supply table ES 1 Primary Secondary ... Use table ES 1 ES 2 ES 2 ES ... ES ... 5
Crop pollination and the impact of the Asian hornet in the EU Pollination potential in 2012 Environmental suitability High (>0.3) Medium (0.2-0.3) Low (0.1-0.2) None (<0.1) 60 N Non EU territories Expert-based model 50 N Land Cover & roads (Food resources and nesting sites) 40 N Irradiance & Temperature (Insect activity) 0 500 km EC-JRC 2019 0 20 E ES Potential ES Demand Distance to semi-natural areas Species-distribution model Species occurrences Land Cover (%) Climate Topography Distance to semi-natural areas ES Actual flow 6
Assessing the shock of Asian hornet on pollination contribution to crop yield (INCA) Pollination potential in 2012 Environmental suitability High (>0.3) Medium (0.2-0.3) Low (0.1-0.2) None (<0.1) 60 N Non EU territories ES Actual flow 50 N 40 N 0 500 km EC-JRC 2019 0 20 E ES Potential ES Demand Non-SNA benefits SNA benefits Belgium France Germany Italy Netherlands Portugal Spain UK 22.15 0.08 18.39 3.30 14.55 2.00 4.22 16.78 Apples, pear and peaches - 0.04 - 0.37 - 0.14 0.32 - Citrus fruits France Italy Spain Portugal Germany Belgium Netherlands Apples, pear and peaches 502.86 562.79 486.59 185.97 681.01 298.35 324.54 13.57 0.07 11.28 1.83 9.05 1.23 2.64 10.27 Other fruits Citrus fruits 1.34 52.46 114.45 8.26 - - - 5.13 0.0004 5.19 0.90 1.11 0.74 0.27 3.35 Other oilseeds Other fruits 155.21 349.93 612.64 42.26 153.42 121.87 117.88 1.27 0.00 1.44 0.23 0.69 0.70 0.09 1.03 Pulses Other oilseeds 2.56 0.01 1.11 0.15 0.71 0.35 0.07 Pulses 12.71 1.27 1.63 0.25 11.77 0.23 0.25 6.78 0.0001 7.40 0.86 8.09 - 0.18 4.39 Rapeseeds Rapeseeds 209.13 2.02 1.74 - 1,037.68 14.59 2.05 - 0.0003 8.37 0.11 - - 1.74 - Soya Soya 3.12 4.87 0.10 - 0.40 - - Sunflower 57.41 13.49 12.47 0.39 12.39 - 0.63 - 0.00 7.98 1.37 7.94 1.11 0.32 5.05 Sunflower Flax and hemp 13.24 0.04 0.37 0.60 2.38 0.68 35.99 1.51 0.00 1.37 0.60 0.22 - 0.08 1.02 Flax and hemp Tomatoes 18.93 98.10 63.78 2.99 10.65 37.49 7 1.35 0.0004 1.45 0.50 1.29 0.82 0.42 1.06 Tomatoes
Assessing the shock of Asian hornet on pollination contribution to crop yield (GTAP) Pollination potential in 2012 Environmental suitability High (>0.3) Medium (0.2-0.3) Low (0.1-0.2) None (<0.1) 60 N Non EU territories ES Actual flow 50 N Country # 4 Country # 3 40 N Country # 2 Country # 1 Country # n 0 500 km EC-JRC 2019 0 20 E Private household Private household Private expenditure Private expenditure ES Potential ES Demand Private consumption Private consumption Taxes Taxes Net investments Net investments Primary factors Primary factors Savings Production: firms Regional household Regional household Production: firms Savings Bank Taxes Taxes Imports Imports Non-SNA benefits SNA benefits Government consumption Government consumption Taxes Taxes Government expenditure Government expenditure Rest of the World Government Government Exports Exports Belgium France Germany Italy Netherlands Portugal Spain UK 9.59 0.04 8.14 1.25 6.39 0.98 1.54 7.28 Vegetables, fruits, pulses Oil seeds Vegetable oils & fats Plant based fibers 1.51 5.13 0.00 0.00 1.37 5.19 0.88 0.78 1.11 8.01 0.74 1.11 0.27 0.74 3.35 4.71 6.77 - 7.91 0.60 0.22 - 0.08 1.02 8
Extract information on economic impact of inaction increase (%) in vegetable and fruit import price decrease (%) in vegetable and fruit production decrease (%) in vegetable and fruit export 9
Thank you alessandra.la-notte@ec.europa.eu 10
