Insights from NPR/RWJF/HSPH Retirement and Health Poll
The NPR/RWJF/HSPH Retirement and Health Poll conducted in July-August 2011 shed light on retirees' experiences and pre-retirees' expectations regarding various aspects of retirement life. The poll compared retirees' assessments of life post-retirement to life pre-retirement across categories like stress, relationships, activities, diet, and more. It also highlighted major differences in expectations versus reality between pre-retirees and retirees, including perspectives on retirement age. The findings provide valuable insights into the retirement landscape and people's perceptions of this life phase.
Uploaded on Sep 23, 2024 | 0 Views
Download Presentation

Please find below an Image/Link to download the presentation.
The content on the website is provided AS IS for your information and personal use only. It may not be sold, licensed, or shared on other websites without obtaining consent from the author.If you encounter any issues during the download, it is possible that the publisher has removed the file from their server.
You are allowed to download the files provided on this website for personal or commercial use, subject to the condition that they are used lawfully. All files are the property of their respective owners.
The content on the website is provided AS IS for your information and personal use only. It may not be sold, licensed, or shared on other websites without obtaining consent from the author.
E N D
Presentation Transcript
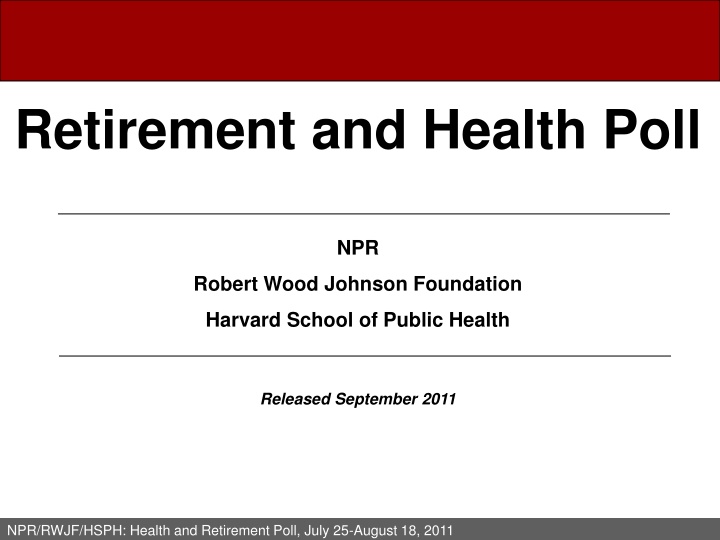
Retirement and Health Poll NPR Robert Wood Johnson Foundation Harvard School of Public Health Released September 2011 NPR/RWJF/HSPH: Health and Retirement Poll, July 25-August 18, 2011
The Retirement Experiences of Retirees and the Expectations of Pre-Retirees 1 NPR/RWJF/HSPH: Health and Retirement Poll, July 25-August 18, 2011
Retirees Assessment of Life in Retirement Compared to Life Before: Overall & Top 5 Positive Aspects of It % of retirees saying life or each aspect of it is better , about the same , or worse in retirement than it was in the 5 years before retirement Life (all in all) since retirement (retirees n=755) 29% 44% 25% Your stress in life (retirees n=346) 39% 35% 24% Your relationship with your family (retirees n=363) 35% 61% 3% Your relationship with your spouse/partner (married/partnered retirees n=179) 34% 62% 3% Doing the activities you like to do (sports, hobbies, volunteering) (retirees n=361) 34% 43% 20% The healthfulness of your diet (retirees n=370) 34% 52% 12% Better About the Same Worse 2 NPR/RWJF/HSPH: Health and Retirement Poll, July 25-August 18, 2011
Expectations vs. Reality: Major Differences Between Pre-Retirees and Retirees % of pre-retirees saying each of the following will be worse than now (pre-retirees) vs. % of retirees saying it is worse than the five years before retirement (retirees) Life overall (pre-retirees n=409, retirees n=755) Pre-Retirees Retirees 14% * 25% Your health (pre-retirees n=194, retirees n=392) 13% * 39% Financial ability to live comfortably during retirement (pre-retirees n=409, retirees n=755) 22% * 35% The overall exercise that you get (pre-retirees n=181, retirees n=355) 1% * 34% Traveling to places you want to go (pre-retirees n=198, retirees n=362) 11% * 34% 3 *Statistically significantly greater than pre-retirees NPR/RWJF/HSPH: Health and Retirement Poll, July 25-August 18, 2011
Perspectives on the Timing of Retirement 4 NPR/RWJF/HSPH: Health and Retirement Poll, July 25-August 18, 2011
Expectations vs. Reality: Retirement Age Pre-retirees: At what age do you expect to retire (or partly retire, for those who never expect to completely retire)? Retirees: At what age did you party or completely retire? 0% Less than 50 10% 6% 50-59 * 29% Pre-Retirees Retirees 19% 60-64 * 31% ** 42% 65-69 16% Age 65 or older: 60% Pre-retirees vs. 26% Retirees ** ** 15% 70-79 8% 3% 80 or above 2% ** 16% Don't know 3% *Statistically significantly greater than pre-retirees **Statistically significantly greater than retirees 5 NPR/RWJF/HSPH: Health and Retirement Poll, July 25-August 18, 2011
Retiring Later: Now vs. Expectations in their 40 s The Age People Did or Plan to Retire Now As Compared to They Age They Thought They Would Retire When they Were in their 40 s Plan to Retire/ Retired at the same age or younger than they thought they would 32% Pre-Retirees Retirees ** 58% Plan to Retire/ Retired later than they thought they would * 39% 12% Don t know 29% 29% *Statistically significantly greater than pre-retirees **Statistically significantly greater than retirees 6 NPR/RWJF/HSPH: Health and Retirement Poll, July 25-August 18, 2011
Primary Reason for Retiring/Planning to Retire Late % among those who think they will retire/retired later than they expected to in their 40s (pre-retirees n=157, retirees n=100) You do not feel you can afford to retire financially ** 54% 17% You enjoy working Pre-Retirees Retirees 17% 29% You want to get the health benefits that come with a job 8% 9% You do not want to be bored 7% 3% You want to make a difference 2% * 8% Some other reason 12% * 33% *Statistically significantly greater than pre-retirees **Statistically significantly greater than retirees 7 NPR/RWJF/HSPH: Health and Retirement Poll, July 25-August 18, 2011
Primary Reasons for Never Fully or Even Partly Retiring % among all non-retired people (n=447) Never expect to retire (partly or fully) 15% --------------------------------------------------------------------------------- % among people who will never retire at all and those who never plan to fully retire (n=64) You do not feel you can afford to retire financially 51% You enjoy working 14% You do not want to be bored 6% You want to make a difference 6% You want to get the health benefits that come with a job 4% Some other reason 20% 8 NPR/RWJF/HSPH: Health and Retirement Poll, July 25-August 18, 2011
Expectations vs. Reality: Annual Income for Living Comfortably in Retirement What annual income do you think you need for you and your family to live comfortably in retirement? Do (you think) you and your family (will have) currently have this annual income? Less than $35,000 Yes, will have/currently have this income 14% 61% * 31% 56% $35,000 to less than $50,000 31% 27% No, will not have/do not have this income $50,000 to less than $75,000 27% ** 27% $35K or more: 81% Pre-retirees vs. 63% Retirees 21% * 35% ** $75,000 or more ** 23% Don t know/refused if have this income ** 15% 8% Don t know 2% 3% 4% Pre-Retirees Retirees *Statistically significantly greater than pre-retirees **Statistically significantly greater than retirees 9 NPR/RWJF/HSPH: Health and Retirement Poll, July 25-August 18, 2011
Steps Taken to Stay Healthy in Retirement 10 NPR/RWJF/HSPH: Health and Retirement Poll, July 25-August 18, 2011
Expectations About Life Expectancy How long do you expect to live (to what age)? Sometime in 50s 0% 1% Pre-Retirees Retirees Sometime in 60s 3% 4% Sometime in 70s 15% 12% ** Sometime in 80s 49% 40% Sometime in 90s 18% 22% 90s or Older: 29% Pre-retirees vs. 32% Retirees 11% To at least 100 10% 4% Don't know * 11% *Statistically significantly greater than pre-retirees **Statistically significantly greater than retirees 11 NPR/RWJF/HSPH: Health and Retirement Poll, July 25-August 18, 2011
Health in Retirement Compared to Your Parents Generation Do you expect your overall health during your retirement to be better, worse or about the same as compared to the overall health of people of your parents generation during their retirement? 58% Better 53% 33% About the same 29% Pre-Retirees Retirees 8% Worse * 14% 0% Don't know * 4% 12 *Statistically significantly greater than pre-retirees NPR/RWJF/HSPH: Health and Retirement Poll, July 25-August 18, 2011
Staying Healthy During Retirement Which of the following have you (already) done in order to stay healthy when you retire (during your retirement)? Maintained good relationships you have with friends/family (pre-retirees n=189, retirees n=377) 95% 94% Watched your weight (pre-retirees n=205, retirees n=377) 83% 76% Seen a doctor regularly (pre-retirees n=211, retirees n=360) 80% * 88% Increased the amount of physical activity or exercise you get (pre-retirees n=203, retirees n=405) ** 72% 44% Changed your diet or the food you eat (pre-retirees n=215, retirees n=397) ** 68% 58% Led a more religious life (pre-retirees n=228, retirees n=368) 40% 45% Pre-Retirees Retirees *Statistically significantly greater than pre-retirees **Statistically significantly greater than retirees 13 NPR/RWJF/HSPH: Health and Retirement Poll, July 25-August 18, 2011
Views on the Roles of Medicare and Medicaid in Retirement 14 NPR/RWJF/HSPH: Health and Retirement Poll, July 25-August 18, 2011
Importance of Medicare and Medicaid % saying they Medicare/Medicaid is or they expect Medicare/Medicaid will be important for them personally during their retirement Importance of Medicare Pre-retirees ** 65% 23% 1% 1% Retirees 74% 15% 2% 1% * Importance of Medicaid 38% 24% 18% 17% * Pre-retirees 38% 19% 14% 24% Retirees Very important Somewhat important Not very important Not at all important *Statistically significantly greater than pre-retirees **Statistically significantly greater than retirees 15 NPR/RWJF/HSPH: Health and Retirement Poll, July 25-August 18, 2011
Beliefs About How Long-Term Nursing Home Care Would Be Paid If you (or your spouse/partner) were to need care in a nursing home for three months (100 days) or more, how would the majority of the costs be paid? Medicare 32% * 43% You or your family using income, savings, investments or family support 23% 17% Pre-Retirees Retirees Private long-term care insurance 18% 16% Medicaid 10% 7% Some other source 9% 7% Don t know 8% 6% Already in a nursing home 0% 1% 16 *Statistically significantly greater than pre-retirees NPR/RWJF/HSPH: Health and Retirement Poll, July 25-August 18, 2011
Problems with Waiting Two Additional Years Before Receiving Benefits: Medicare If you had been/were asked to wait two years longer before receiving Medicare benefits, would that have been/be a major problem, a minor problem, or not a problem at all for you and your family? Major problem 33% 36% ** Minor problem Problem: 67% Pre-retirees vs. 60% Retirees ** 35% 25% Not a problem at all Pre-Retirees Retirees 21% * 31% Don t know 1% 2% Not enrolled and never plan to enroll in Medicare 6% 4% *Statistically significantly greater than pre-retirees **Statistically significantly greater than retirees 17 NPR/RWJF/HSPH: Health and Retirement Poll, July 25-August 18, 2011
Confidence in Medicare How confident are you that Medicare will continue to provide benefits of at least equal value to benefits received by retirees today through the end of your retirement? 10% Very confident * 20% * Confident: 38% Pre-retirees vs. 52% Retirees 28% Somewhat confident 32% Pre-Retirees Retirees ** 37% Not very confident 27% ** 25% Not at all confident 17% *Statistically significantly greater than pre-retirees **Statistically significantly greater than retirees 18 NPR/RWJF/HSPH: Health and Retirement Poll, July 25-August 18, 2011
Government Changes to Medicare to Control the Costs of the Program % saying they think the government should Completely overhaul Medicare to control the cost of the program ** 21% 12% Overhaul or major change: 47% Pre-retirees vs. 32% Retirees ** Make major changes to Medicare but not completely overhaul it ** 26% 20% Make minor changes to Medicare 30% Pre-Retirees Retirees 30% Not try to control the costs of Medicare 13% * 27% Don t know 9% 11% *Statistically significantly greater than pre-retirees **Statistically significantly greater than retirees 19 NPR/RWJF/HSPH: Health and Retirement Poll, July 25-August 18, 2011
Pre-Retirees: Likelihood that Each of These Problems Will Happen During Retirement Will have trouble paying health care insurance premiums (pre-retirees n=227) 31% 34% 65% Will have trouble paying for long-term care* if you (or your spouse/partner) need it (pre-retirees n=252) 30% 38% 68% Will have trouble paying overall medical bills for you (or your spouse/partner) (pre-retirees n=228) 60% 27% 34% Will have trouble paying for the drugs you (or your spouse/partner) need (pre-retirees n=235) 60% 24% 36% Will have trouble finding high quality care (pre-retirees n=234) 58% 24% 33% Will have trouble seeing the doctor of your choice (pre-retirees n=234) 57% 23% 34% Will have trouble affording preventive services you (or your spouse/partner) need (pre-retirees n=222) 59% 21% 37% Very likely Somewhat likely 20 *Note: Long-term care, such as care in a nursing home, assisted living, or home care NPR/RWJF/HSPH: Health and Retirement Poll, July 25-August 18, 2011
Retirees: Problems That Have Happened Since They Retired Have had trouble paying for the drugs you (or your spouse/partner) need (retirees n=439) 22% Have had trouble paying health care insurance premiums (retirees n=449) 21% Have had trouble paying overall medical bills for you (or your spouse/partner) (retirees n=432) 21% Have had trouble paying for long-term care* if you (or your spouse/partner) need it (retirees n=434) 19% Have had trouble affording preventive services you (or your spouse/partner) need (retirees n=406) 18% Have had trouble seeing the doctor of your choice (retirees n=439) 13% Have had trouble finding high quality care (retirees n=432) 13% 21 *Note: Long-term care, such as care in a nursing home, assisted living, or home care NPR/RWJF/HSPH: Health and Retirement Poll, July 25-August 18, 2011
Perceptions of What Makes a Community a Healthy Place for Retired People 22 NPR/RWJF/HSPH: Health and Retirement Poll, July 25-August 18, 2011
Community Factors That Are Very Important in Helping Retired People Stay Healthy Retired people in some communities are healthier than others. How important do you think each of the following things is in helping retired people stay healthy? Clean air and water (pre-retirees n=194, retirees n=375) 88% 90% Low crime rate (pre-retirees n=178, retirees n=360) 86% 80% Access to affordable fresh fruits and vegetables (pre-retirees n=184, retirees n=350) 83% 79% Access to high quality doctors and hospitals (pre-retirees n=201, retirees n=350) 82% 84% Access to outdoor space for walking, jogging, and sports (pre-retirees n=191, retirees n=347) ** 80% 68% Access to pharmacies or drug stores (pre-retirees n=197, retirees n=348) 65% * 77% *Statistically significantly greater than pre-retirees **Statistically significantly greater than retirees Pre-Retirees Retirees 23 NPR/RWJF/HSPH: Health and Retirement Poll, July 25-August 18, 2011
Concerns about Being Admitted to a Nursing Home During Retirement 24 NPR/RWJF/HSPH: Health and Retirement Poll, July 25-August 18, 2011
Top Worries About Nursing Homes % saying they would be very or somewhat worried about each Being in an institutional environment that is not as comfortable as a home 82% Pre-retirees (n=223) Retirees (n=412) 52% 29% 78% 45% 33% The cleanliness of the facility 78% Pre-retirees (n=237) Retirees (n=439) 49% 29% 74% 46% 27% Having too few nurses to provide the care you needed 77% 39% 38% Pre-retirees (n=208) Retirees (n=420) 69% 33% 36% The quality of health care provided 76% 38% 37% Pre-retirees (n=212) Retirees (n=420) 69% 35% 34% Having limited privacy ** 74% 40% 34% Pre-retirees (n=237) Retirees (n=421) 35% 30% 65% Spending all your time around people who are very sick 73% 37% 36% Pre-retirees (n=213) Retirees (n=391) Very worried Somewhat worried ** 64% 34% 30% Fraud and waste by managers of nursing homes Pre-retirees (n=207) Retirees (n=410) 73% 36% 37% 34% 29% 64% 25 **Statistically significantly greater than retirees NPR/RWJF/HSPH: Health and Retirement Poll, July 25-August 18, 2011
