Increasing Profitability and Efficiency in Business Strategy
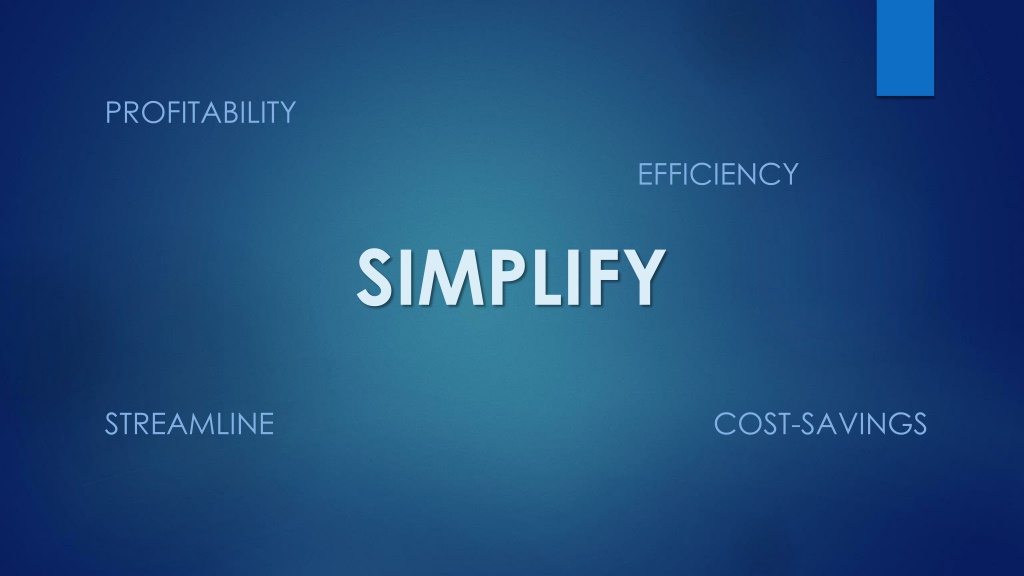


SIMPLIFY
SIMPLIFY
STREAMLINE
EFFICIENCY
COST-SAVINGS
PROFITABILITY

PEPPERFRY.COM:
PEPPERFRY.COM:
TURNING THE TABLES
TURNING THE TABLES
ON DISRUPTION
ON DISRUPTION
ODETTE CONSULTING: Brandon Lalonde, Jacob McCourt, Jordan
ODETTE CONSULTING: Brandon Lalonde, Jacob McCourt, Jordan
Neposlan, Sahi Veeraraghavan
Neposlan, Sahi Veeraraghavan
PRESENTING TO: PEPPERFRY.COM EXECUTIVE TEAM
PRESENTING TO: PEPPERFRY.COM EXECUTIVE TEAM
THE CHALLENGE
THE CHALLENGE
How can the company increase
How can the company increase
profitability and what would that
profitability and what would that
profitability look like over the next
profitability look like over the next
five years?
five years?
Agenda
Agenda
Agenda
Agenda
SWOT Analysis of Pepperfry.com
SWOT Analysis of Pepperfry.com
PEST Analysis of Pepperfry.com
PEST Analysis of Pepperfry.com
P
E
S
T
Porter’s Five Forces
Porter’s Five Forces
Analysis of
Analysis of
Pepperfry.com
Pepperfry.com
Competitive
Competitive
Rivalry
Rivalry
HIGH
HIGH
•
Large number of
competitors (i.e.
Walmart and
IKEA)
Agenda
Agenda
Key Issues
Current Issues
Current Issues
Future Risks
Future Risks
Key Issues
Future Risks
Future Risks
Risk Avoidance Plan
Risk Avoidance Plan
Agenda
Agenda
Alternatives
Alternatives
Agenda
Agenda
Making a Decision
Recommendation
Agenda
Agenda
Assumptions
Assumptions
Financial Overview
Financial Overview
Agenda
Agenda
Implementation Plan
Project Timeline
Conclusion
We now welcome any questions.
We now welcome any questions.
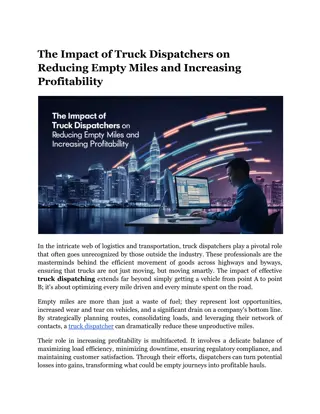
Streamline, Efficiency, Cost-Savings, Profitability. All of these words describe the goals of a firm looking to create and sustain profitability. One way to do that is to SIMPLIFY business operations.
Analyzing Pepperfry.com's current situation through SWOT and PEST analysis, along with a focus on profitability and cost-savings strategies. The presentation to the executive team highlights key issues, alternatives, and recommendations for future growth over the next five years.

Download Presentation

Please find below an Image/Link to download the presentation.
The content on the website is provided AS IS for your information and personal use only. It may not be sold, licensed, or shared on other websites without obtaining consent from the author. Download presentation by click this link. If you encounter any issues during the download, it is possible that the publisher has removed the file from their server.
E N D
Presentation Transcript
PROFITABILITY EFFICIENCY SIMPLIFY STREAMLINE COST-SAVINGS
PEPPERFRY.COM: TURNING THE TABLES ON DISRUPTION ODETTE CONSULTING: Brandon Lalonde, Jacob McCourt, Jordan Neposlan, Sahi Veeraraghavan PRESENTING TO: PEPPERFRY.COM EXECUTIVE TEAM
THE CHALLENGE How can the company increase profitability and what would that profitability look like over the next five years?
Agenda Situational Analysis Key Issues Alternatives Recommendation Financial Overview Implementation Plan
Agenda Situational Analysis Key Issues Alternatives Recommendation Financial Overview Implementation Plan
SWOT Analysis of Pepperfry.com Weaknesses -Low profitability Strengths -Large product variety -Geographic spread-98% of orders are shipped in less than 48 hours; hub and spoke model -Physical retail driving high average sales -Very complex business structure-a lot of business units -Highly reliant on the co-founders of the business SWOT Analysis Threats Opportunities -IKEA entering the market -Highly fragmented business (a lot of suppliers) -Expand by opening up physical stores in other major cities -Promote private label house brands -Expand operations in Malaysia and China
PEST Analysis of Pepperfry.com E S T P -Varying cultures in each city in India -Average Furniture rental = 22-29 years -Average Family keeps their Furniture for 30 years - TV advertising and influencer marketing is very popular - Use of technology among teenagers is low in rural areas - Only 20% of the country is online Less regulations compared to North American companies = Ease of foreign investment Rupee value tied to United States dollar
Porters Five Forces Analysis of Pepperfry.com Consumers can meet their needs offline or online High capital bar for entry Threat of New Entrants LOW-MEDIUM Buyer Bargaining Power HIGH Competitive Rivalry HIGH Supplier Bargaining Power LOW Threat of Substitution LOW-MEDIUM Large number of competitors (i.e. Walmart and IKEA) Some unique items but high competition Assists business with logistics and other support
Agenda Situational Analysis Key Issues Alternatives Recommendation Financial Overview Implementation Plan
Key Issues Current Issues Future Risks New Revenue Channels are lacking Competitors will explore untapped markets for growth Do not reach profitability goals and the business is liquidated and/or sold Decreasing Profitability Competitors may expand into the market and cause limited growth Degree of Competition If the company does not innovate with new products or programs, they remain stagnant Need for Innovation Main Take-away: The firm must find new revenue channels to remain profitable. Competitor entry risk must be mitigated.
Key Issues Future Risks Risk Avoidance Plan Explore new revenue streams but avoid more complexity Competitors will explore untapped markets for growth Do not reach profitability goals and the business is liquidated and/or sold Simplify business operations Competitors may expand into the market and cause limited growth Solidify profitability plan and then expand If the company does not innovate with new products or programs, they remain stagnant Continue to monitor and look for new opportunities Main Take-away: The firm must mitigate risks by simplifying the business and monitoring profitable growth opportunities.
Agenda Situational Analysis Key Issues Alternatives Recommendation Financial Overview Implementation Plan
Alternatives Alternative #1: Simplify and expand private label house brands strategy Alternative #2: Simplify and geographically expand physical store location Alternative #3: Simplify and explore the furniture rental market
Alternatives Decision Criteria Simplify + Expand House Brands Strategy Simplify + Expand Physical Stores Geographically Simplify + Explore Furniture Rental Market Risk 8 6 4 Complexity 6 6 4 Profitability 8 5 7 Unique and Innovative 7 6 8 1-3 4-6 7-10 TOTALS 29 23 23 Data was collected via an independent poll by Odette Consulting
Agenda Situational Analysis Key Issues Alternatives Recommendation Financial Overview Implementation Plan
Making a Decision Decision Criteria Simplify + Expand House Brands Strategy Simplify + Expand Physical Stores Geographically Simplify + Explore Furniture Rental Market Risk 8 6 4 Complexity 6 6 4 Profitability 8 5 7 Unique and Innovative 7 6 8 1-3 4-6 7-10 TOTALS 29 23 23 Data was collected via an independent poll by Odette Consulting
Recommendation Create simpler operations Increase profitability Simplify Operations and Expand House Brands Strategy
Agenda Situational Analysis Key Issues Alternatives Recommendation Financial Overview Implementation Plan
Assumptions Tax Depreciation and Amortization are not taken into account Revenue Growth will plateau at 25% Projected Decrease in COGS We have moved out of the utility industry
Financial Overview 2012/1 3 2013/1 4 INR Millions 2014/15 2015/16 2016/17 2017/18 2018/192019/202020/212021/22 3,121.8 0 4,090.8 0 - 969.00 3,433.9 8 3,886.2 6 - 452.28 3,777.3 8 3,691.9 4 85.44 4,155.1 2 3,507.3 5 647.77 341.00 439.00 992.00 2,001.00 2,580.00 2,838.00 Revenue 883.00 - 542.00 801.00 - 362.00 2,247.00 - 1,255.00 4,993.00 - 2,992.00 5,066.00 - 2,486.00 4,306.10 - 1,468.10 COGS Profit/(Loss) Projected Revenue Growth Projected Decrease in COGS 10% 15%
Financial Overview 2013/1 4 439.00 801.00 - 362.00 INR Millions 2012/13 341.00 883.00 - 542.00 2014/15 2015/16 2016/17 2017/18 2018/19 2019/20 2020/21 2021/22 992.00 2,001.00 2,580.00 3,225.00 2,247.00 4,993.00 5,066.00 4,306.10 - 1,255.00 2,992.00 2,486.00 1,081.10 4,031.25 4,090.80 - 59.55 5,039.06 3,886.26 1,152.81 6,298.83 3,691.94 2,606.89 7,873.54 3,507.35 4,366.19 Revenue COGS - - - Profit/(Loss) Projected Revenue Growth 25% Projected Decrease in COGS 15%
Agenda Situational Analysis Key Issues Alternatives Recommendation Financial Overview Implementation Plan
Implementation Plan Simplify Return to Profitability and Expand Growth and Prepare for I.P.O. Continue to rationalize SKU s Create targeted marketing campaigns for under- penetrated areas Seek opportunities to sell second brand into adjacent markets Evaluate success of house brand strategy Formulate contingency plans Explore furniture rental or expand geographically Create mobile app Prepare for Initial Public Offering Rationalize SKU count D cor reduce from 70,000 SKU s to 5,000 SKU s Utilities Stop selling House Brands 10 brands to 2 brands Pepperfry (13-tier brand) sold online and catalogue Sold to other suppliers Implement quality assurance model Process improvement
Project Timeline 2018 2019 2020 2021 2022 Work with category managers to rationalize SKU's Work on new house brands Launch new house brands Implement new sourcing strategy Explore other opportunities for process improvement Develop new marketing campaigns Develop new app Evaluate SKU rationalization process Launch mobile app Launch digital COE for digitization Launch new marketing campaigns around major holidays Prepare for IPO IPO
Conclusion Lack of new revenue channels to increase profitability Issue Simplify business operations by expanding house brand strategy Recommendation
THANK YOU We now welcome any questions.