Implementation Plan for Land Reform (Labour Tenants) Act: Progress Report and Budget Allocation
The Department, under the oversight of a Special Master, is processing outstanding claims by labour tenants as per the Land Reform (Labour Tenants) Act of 1996. A court order mandated the development of an Implementation Plan, including budget allocation and reporting requirements, to address the backlog of claims. The plan involves coordination with the Special Master and the Land Claims Court, setting targets for claim resolution, assessing resource needs, and submitting quarterly progress reports.
Download Presentation

Please find below an Image/Link to download the presentation.
The content on the website is provided AS IS for your information and personal use only. It may not be sold, licensed, or shared on other websites without obtaining consent from the author.If you encounter any issues during the download, it is possible that the publisher has removed the file from their server.
You are allowed to download the files provided on this website for personal or commercial use, subject to the condition that they are used lawfully. All files are the property of their respective owners.
The content on the website is provided AS IS for your information and personal use only. It may not be sold, licensed, or shared on other websites without obtaining consent from the author.
E N D
Presentation Transcript
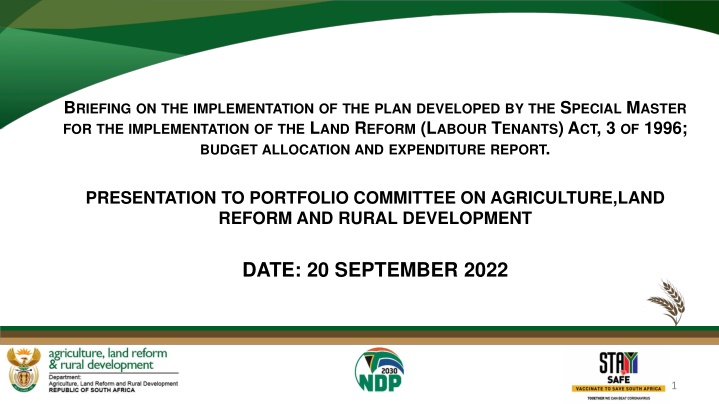
BRIEFINGONTHEIMPLEMENTATIONOFTHEPLANDEVELOPEDBYTHE SPECIAL MASTER FORTHEIMPLEMENTATIONOFTHE LAND REFORM (LABOUR TENANTS) ACT, 3 OF 1996; BUDGETALLOCATIONANDEXPENDITUREREPORT. PRESENTATION TO PORTFOLIO COMMITTEE ON AGRICULTURE,LAND REFORM AND RURAL DEVELOPMENT DATE: 20 SEPTEMBER 2022 1
BACKGROUND ON THE LABOUR TENANTS ACT Land Reform (Labour Tenants) Act 3 of 1996: The purpose of this Act is to provide for security of tenure of labour tenants plus those persons occupying or using land as a result of their association with labour tenants; and to provide for the award of land and rights in land by labour tenants to secure their land tenure. The Department received labour tenant claims in terms of section 16 and 17 of the Act and is currently processing these applications for awards of land by labour tenants, which were made not later than 31 March 2001. The Department received 20, 460 claims and 10 992 claims have since been finalized. There are approximately 9, 468 applications still outstanding with the majority in KZN followed by Mpumalanga Province. 2
BACKGROUND ON THE LABOUR TENANTS ACT contd The Department was taken to Court through the class action on behalf of labour tenants to compel the Department to process the claims, and for the appointment of a Special Master to supervise the Department s processing of those applications. The Constitutional Court confirmed an order of the Land Claims Court that the Department must process the outstanding applications and that a Special Master for Labour Tenants (SMLT) be appointed. The Office of the Special Master s role is to supervise, monitor and oversee the functions of the Department in the resolution of outstanding claims in terms of the Land Reform (Labour Tenants) Act, 1996. The Department working with the Special Master on Labour tenants was ordered by the court to prepare and submit a Labour tenants Implementation plan for the settlement of outstanding labour tenant claims and was approved by the Court on 3 September 2020. 3
BACKGROUND ON THE COURT ORDER According to paragraph 6 of the Court Order dated October 29, 2019, the Court requested that the Implementation Plan provide certain data regarding the outstanding claims as follows: The total number of claims lodged to date, and the number which have not yet been processed and finalized; An assessment of the skill pool and other infrastructure required for processing labour tenant claims, and to what extent such skill pool and infrastructure is available within the Department of Rural Development and Land Reform ( the Department ); Targets, on a year-to-year basis, for the resolution of pending labour tenant claims, either by agreement or by referring the claim to the Court; A determination of the budget necessary during each financial year for carrying out the Implementation Plan, including both the Department s operating costs for processing claims and the amounts required to fund awards made pursuant to applications in terms of section 16 of the Act; Plans for co-ordination with the Court to ensure the rapid adjudication or arbitration of unresolved claims referred to the Court in terms of section 18(7) read with sections 19 to 25 of the Act; and Any other matters which the special master may consider relevant. The department together with the Special Master is ordered to submit reports on a quarterly basis to the Land Claims Court on the progress regarding the implementation of the LT implementation plan. 4
LABOUR TENANT CLAIMS STATISTICAL INFORMATION This area still remains a challenge and the processing of outstanding land claims is very slow. The agreed targets had to be reviewed and introduction of new processes were implemented i.e Historical and Geo- spatial research. Targets Province Lodged Settled Outstanding 4 0 4 Eastern Cape 15 1 14 Free State A Multisite Accelerated Claims Resolution Initiative was introduced by the Special Master on Labour Tenants (LT) and has been adopted and is being rolled out, parallel to the establishment of a credible database, DALRRD capacity to deliver on this project and the roll out of the LT implementation plan still a challenge. 403 65 338 Gauteng 11 446 6 125 5 321 KwaZulu-Natal 294 1 293 Limpopo 8 286 4 796 3 490 Mpumalanga 11 5 6 North West Targets: 500 in 2020/21; 1500 for 2021/22; 2000 for 2022/23 2500 for 2023/24 1 0 1 Northern Cape 0 0 0 Western Cape 20 460 10 992 9 468 Total 5 6
CURRENT IMPLEMENTATION CHALLENGES a) Untraceable claimants due to relocation or natural causes like death. b) Overlapping land claims(labour tenancy and Land Restitution claims c) Denial of labour tenancy status by landowners leading to litigation. d) Recalcitrant landowners or reluctant landowners to co-operate and denial of labour tenant status remains a challenge. e) Illegal eviction of labour tenants f) Illegal waiver of labour tenant rights by landowners g) Capacity within the Office of the State Attorney to handle volumes of LT court referrals h) Rejection of OVG offers by affected landowners resulting in delays in the acquisition of land and budget expenditure. i) Lack of capacity within the Department to process labour tenant applications at both national and provincial level (only 131 posts are available and responsible for the implementation of all land tenure legislation) j) Long drawn-out litigation processes in the courts, k) Processing of cases to court is very slow due to capacity issues in the State attorney's office. Challenges 6
BUDGET ALLOCATION FOR FARM DWELLERS inclusive of Labour tenants Programme 3: Budget Allocation and share with other Core Programmes Tenure reform budget allocation is a combination of Land acquisition under ESTA and LTA Household 2020/21 Share % Original Alloctation Share % Adjusted Allocation Original Allocation Adjusted Allocation Land Redistribution & Tenure Reform Restitution & Food Security TOTAL 219,722 2,995,999 3,215,721 128,528 2,404,850 2,533,378 7 5 93 100 95 100 Household -2021/22 Land Redistribution & Tenure Reform Restitution & Food Security TOTAL 312,649 3,157,804 3,470,453 259,585 3,018,631 3,278,216 9 8 91 100 92 100 7
PROGRESS ON LABOUR TENANTS CLAIMS FINALIZED DURING THE PERIOD LABOUR TENANTS APPLICATIONS FINALIZED 2019-2022 Hectares Attached to Farm Dwellers inclusive of Labour tenants BENEFICIARIES/TARGET GROUPS Labour Tenants Finalized FY Females Youth 2019/20 486 5 358 130 85 196 2020/21 153 43 10 529 2021/22 108 4 013 277 178 TOTALS 19 900 560 306 790 8
PERFORMANCE IN PROVIDING LONG TERMS SECURITY OF TENURE TO FARM DWELLERS TENURE ACQUISITION SINCE 2017/2018 - MARCH 2022 Number of Individuals Benefited Number of Youth (<=35 years) Benefited Number of People with Disabilities Benefited Land Purchase Price R5 605 000 R13 100 000 R19 637 000 R220 163 680 R39 113 822 R31 706 850 R1 000 000 8 R330 326 352 Hectares Acquired Number of Females Benefited PSSC Number of Farms Eastern Cape Free State Gauteng KwaZulu Natal Mpumalanga North West Western Cape Grand Total 2 1 7 95 20 29 213 1 712 369 164 10 13 114 700 198 78 13 18 69 472 156 26 1 0 3 2 2 0 0 1 964 283 22 488 3 964 3 414 48 15 9 1 83 18 9 4 6 32 226 2 516 1 117 760 The Department of Agriculture, Land Reform and Rural Development acquired 32 226 hectares of land through the Land Tenure since April 2017 to March 2022. The number of Farms acquired amount to 83 and benefited over 2 500 individuals, of which over 1 100 are females, over 700 are young people and 8 are people with disability. 9
HOUSEHOLD BUDGET ALLOCATION AND EXPENDITURE 2019/20 FY Tenure reform budget allocation and expenditure is a combination of Land acquisition under ESTA and LTA Expenditure as at 31 March 2020 Budget Balance R'000 Over/Under Expenditure R'000 BUDGET ALLOCATION 2019/20 R'000 % Budget Spending PROVINCE EASTERN CAPE 15 637 43 15 594 0% 15 594 FREE STATE 10 093 1 775 8 318 18% 8 318 GAUTENG 10 188 1 294 8 894 13% 8 894 KWAZULU-NATAL 40 844 83 438 -42 594 204% -42 594 LIMPOPO 819 794 25 97% 25 MPUMALANGA 62 843 17 906 44 937 28% 44 937 NORTHERN CAPE 1 470 173 1 297 12% 1 297 NORTH WEST 31 981 20 721 11 260 65% 11 260 WESTERN CAPE 19 110 1 413 17 697 7% 17 697 TOTAL 192 985 127 557 65 428 66% 65 428 10
HOUSEHOLD BUDGET ALLOCATION AND EXPENDITURE 2020/21 FY BUDGET ALLOCATION 2020/21 R'000 Expenditure as at 31 March 2021 Budget Balance R'000 % Budget Spending Over/Under Expenditure PROVINCE R'000 EASTERN CAPE 169 4 014 -3 845 2375% -3 845 FREE STATE 2 138 0 2 138 0% 2 138 GAUTENG 5 156 7 103 -1 947 138% -1 947 KWAZULU-NATAL 49 403 57 667 -8 264 117% -8 264 LIMPOPO 933 915 18 98% 18 MPUMALANGA 45 611 19 614 25 997 43% 25 997 NORTHERN CAPE 754 0 754 0% 754 NORTH WEST 13 238 6 857 6 381 52% 6 381 WESTERN CAPE 11 126 41 11 085 0% 11 085 TOTAL 128 528 96 211 32 317 75% 32 317 11
HOUSEHOLD BUDGET ALLOCATION AND EXPENDITURE 2021/22 FY BUDGET ALLOCATION 2021/22 R'000 Over/Under Expenditure R'000 Expenditure as at 31 March 2022 Budget Balance R'000 PROVINCE % Budget Spending EASTERN CAPE 28 343 4 449 23 894 16% 23 894 FREE STATE 9 000 0 9 000 0% 9 000 GAUTENG 21 538 16 372 5 166 76% 5 166 KWAZULU-NATAL 68 497 27 512 40 985 40% 40 985 LIMPOPO 334 263 71 79% 71 MPUMALANGA 67 093 8 116 58 977 12% 58 977 NORTHERN CAPE 6 822 1 899 4 923 28% 4 923 NORTH WEST 43 726 6 899 36 827 16% 36 827 WESTERN CAPE 14 232 5 14 227 0% 14 227 TOTAL 259 585 65 515 194 070 25% 194 070 12
