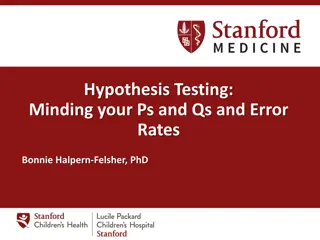
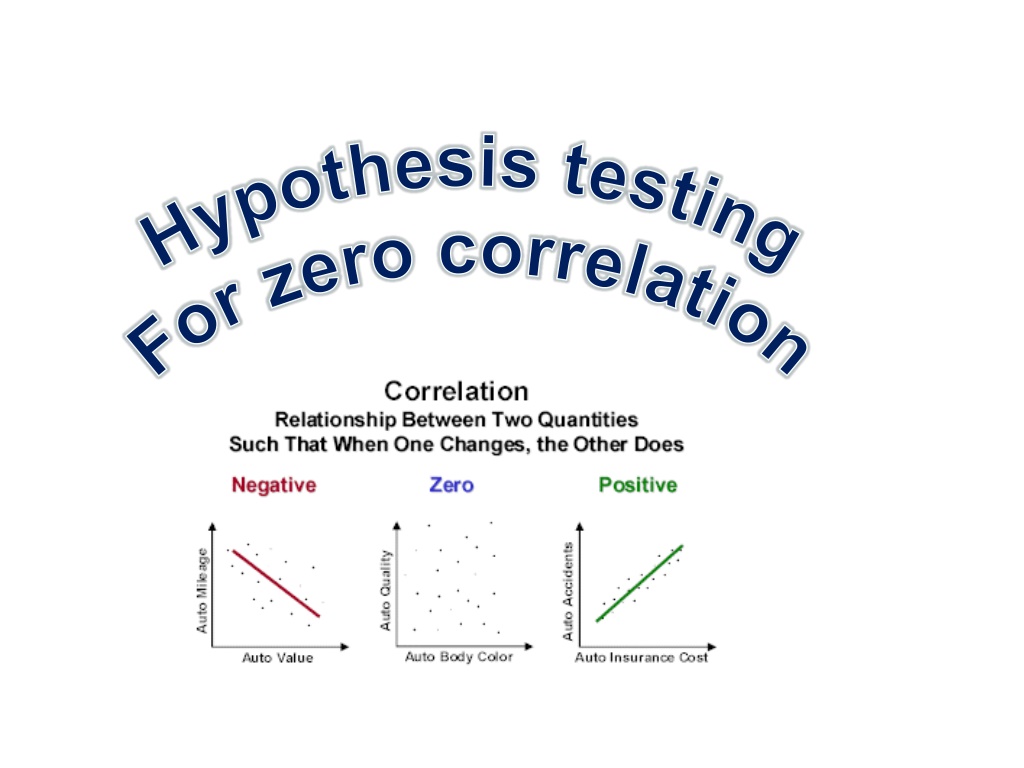
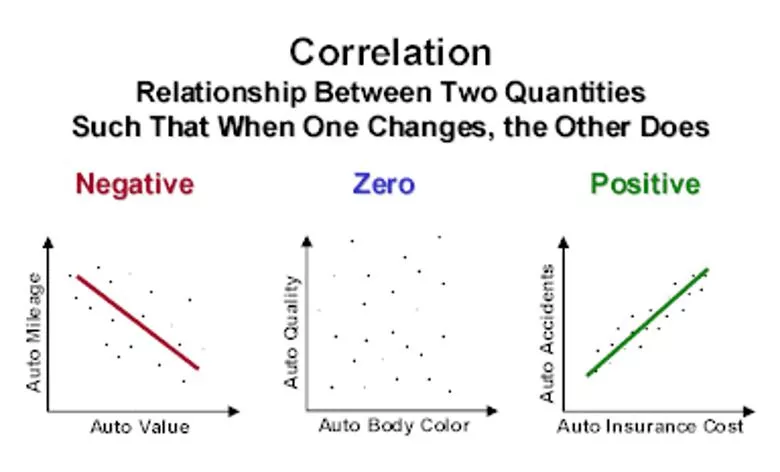
Hypothesis testing for zero correlation


S
t
a
t
i
s
t
i
c
s
:
P
m
c
c
a
n
d
h
y
p
o
t
h
e
s
i
s
t
e
s
t
s

•
KUS objectives
BAT
use a hypothesis test to determine if the pmcc for
a sample indictates there is likely to be a linear
relationship in the population


D
a
t
a
s
u
g
g
e
s
t
s
t
h
e
r
e
m
a
y
b
e
a
n
e
g
a
t
i
v
e
c
o
r
r
e
l
a
t
i
o
n
D
a
t
a
s
u
g
g
e
s
t
s
t
h
e
r
e
m
a
y
n
o
t
b
e
a
c
o
r
r
e
l
a
t
i
o
n
(what problems are there with data for cloud cover?)
D
a
t
a
s
u
g
g
e
s
t
s
t
h
e
r
e
m
a
y
b
e
a
c
o
r
r
e
l
a
t
i
o
n
However, common sense suggests we investigate further
N
o
t
e
s
h
y
p
o
t
h
e
s
i
s
t
e
s
t
i
n
g
f
o
r
z
e
r
o
c
o
r
r
e
l
a
t
i
o
n
F
o
r
a
o
n
e
t
a
i
l
e
d
t
e
s
t
e
i
t
h
e
r
F
o
r
a
t
w
o
t
a
i
l
e
d
t
e
s
t
T
o
f
i
n
d
t
h
e
C
r
i
t
i
c
a
l
r
e
g
i
o
n
:
u
s
e
t
h
e
t
a
b
l
e
o
f
v
a
l
u
e
s
i
n
t
h
e
f
o
r
m
u
l
a
b
o
o
k
l
e
t
p
a
g
e
3
7
Y
o
u
n
e
e
d
t
h
e
s
i
g
n
i
f
i
c
a
n
c
e
l
e
v
e
l
a
n
d
t
h
e
s
a
m
p
l
e
s
i
z
e
T
h
e
t
a
b
l
e
g
i
v
e
s
t
h
e
c
r
i
t
i
c
a
l
v
a
l
u
e
b
e
t
w
e
e
n
0
a
n
d
1
(
c
o
n
t
i
n
u
o
u
s
d
a
t
a
)
S
o
f
o
r
a
c
r
i
t
i
c
a
l
v
a
l
u
e
b
e
t
w
e
e
n
-
1
a
n
d
0
w
e
c
h
a
n
g
e
s
i
g
n
o
n
t
h
e
v
a
l
u
e
o
r
WB 12
A researcher wishes to investigate if there is a positive correlation between the number of vehicles and the number
of road fatalities in European countries.
He selects a random sample of 10 European countries and records the number of vehicles,
v
per 1000 people, and the
number of road fatalities,
r
per 100 000 population, for a particular year. These are shown in the table and scatter diagrams.
a
W
h
a
t
i
s
t
h
e
d
e
f
i
n
i
t
i
o
n
o
f
a
c
r
i
t
i
c
a
l
v
a
l
u
e
?
(
1
)
b
T
h
e
p
r
o
d
u
c
t
m
o
m
e
n
t
c
o
r
r
e
l
a
t
o
n
c
o
e
f
f
i
c
i
e
n
t
f
o
r
v
a
n
d
r
i
s
0
.
7
1
4
.
U
s
e
t
h
i
s
v
a
l
u
e
t
o
t
e
s
t
f
o
r
p
o
s
i
t
i
v
e
c
o
r
r
e
l
a
t
i
o
n
a
t
t
h
e
5
%
s
i
g
n
i
f
i
c
a
n
c
e
l
e
v
e
l
.
I
n
t
e
r
p
r
e
t
y
o
u
r
r
e
s
u
l
t
i
n
c
o
n
t
e
x
t
.
(
3
)
c
T
h
e
r
e
s
e
a
r
c
h
e
r
w
i
s
h
e
s
t
o
p
r
e
d
i
c
t
t
h
e
n
u
m
b
e
r
o
f
r
o
a
d
f
a
t
a
l
i
t
i
e
s
f
o
r
a
c
o
u
n
t
r
y
w
i
t
h
6
5
0
v
e
h
i
c
l
e
s
p
e
r
1
0
0
0
p
e
o
p
l
e
.
W
r
i
t
e
d
o
w
n
t
h
e
r
e
g
r
e
s
s
i
o
n
m
o
d
e
l
h
e
s
h
o
u
l
d
u
s
e
.
(
1
)
d
S
t
a
t
e
t
h
e
d
e
p
e
n
d
e
n
t
v
a
r
i
a
b
l
e
f
o
r
t
h
e
r
e
g
r
e
s
s
i
o
n
m
o
d
e
l
i
n
p
a
r
t
c
.
(
1
)
e
M
o
n
a
c
o
h
a
s
8
9
9
v
e
h
i
c
l
e
s
p
e
r
1
0
0
0
p
e
o
p
l
e
.
E
x
p
l
a
i
n
w
h
y
t
h
e
m
o
d
e
l
s
t
a
t
e
d
i
n
c
i
s
n
o
t
r
e
l
i
a
b
l
e
f
o
r
e
s
t
i
m
a
t
i
n
g
t
h
e
n
u
m
b
e
r
o
f
r
o
a
d
f
a
t
a
l
i
t
i
e
s
i
n
M
o
n
a
c
o
.
(
1
)
WB 12
ANSWERS
e
M
o
n
a
c
o
h
a
s
8
9
9
v
e
h
i
c
l
e
s
p
e
r
1
0
0
0
p
e
o
p
l
e
.
E
x
p
l
a
i
n
w
h
y
t
h
e
m
o
d
e
l
s
t
a
t
e
d
i
n
c
i
s
n
o
t
r
e
l
i
a
b
l
e
f
o
r
e
s
t
i
m
a
t
i
n
g
t
h
e
n
u
m
b
e
r
o
f
r
o
a
d
f
a
t
a
l
i
t
i
e
s
i
n
M
o
n
a
c
o
.
(
1
)
d
S
t
a
t
e
t
h
e
d
e
p
e
n
d
e
n
t
v
a
r
i
a
b
l
e
f
o
r
t
h
e
r
e
g
r
e
s
s
i
o
n
m
o
d
e
l
i
n
p
a
r
t
c
.
(
1
)
c
T
h
e
r
e
s
e
a
r
c
h
e
r
w
i
s
h
e
s
t
o
p
r
e
d
i
c
t
t
h
e
n
u
m
b
e
r
o
f
r
o
a
d
f
a
t
a
l
i
t
i
e
s
f
o
r
a
c
o
u
n
t
r
y
w
i
t
h
6
5
0
v
e
h
i
c
l
e
s
p
e
r
1
0
0
0
p
e
o
p
l
e
.
W
r
i
t
e
d
o
w
n
t
h
e
r
e
g
r
e
s
s
i
o
n
m
o
d
e
l
h
e
s
h
o
u
l
d
u
s
e
.
(
1
)
b
T
h
e
p
r
o
d
u
c
t
m
o
m
e
n
t
c
o
r
r
e
l
a
t
o
n
c
o
e
f
f
i
c
i
e
n
t
f
o
r
v
a
n
d
r
i
s
0
.
7
1
4
.
U
s
e
t
h
i
s
v
a
l
u
e
t
o
t
e
s
t
f
o
r
p
o
s
i
t
i
v
e
c
o
r
r
e
l
a
t
i
o
n
a
t
t
h
e
5
%
s
i
g
n
i
f
i
c
a
n
c
e
l
e
v
e
l
.
I
n
t
e
r
p
r
e
t
y
o
u
r
r
e
s
u
l
t
i
n
c
o
n
t
e
x
t
.
(
3
)
a
W
h
a
t
i
s
t
h
e
d
e
f
i
n
i
t
i
o
n
o
f
a
c
r
i
t
i
c
a
l
v
a
l
u
e
?
(
1
)
A critical value is the point (or points) on the scale of the test
statistic beyond which we reject the null hypothesis.
Road fatalities per 100 000 population
Outside the range of the data used in the model.
(
This would require extrapolation)
The scientist believes there is no correlation between the masses of the two
reactants. Test, at the 10% level of significance, the scientists claim, stating your
hypothesis clearly
There is evidence, at the 10% level significance that there is a correlation
between the masses of the two reactants
WB 14
data from the LDS is given in the table. X is daily maximum gust (kn) and
Y is daily maximum relative humidity(%) in Leeming for a sample of eight days in
May.
a) Find the pmcc for these data
b) Test, at the 10% significance level, whether there is sufficient evidence of a
positive correlation in the data. State your hypothesis clearly
T
h
e
r
e
i
s
n
o
t
e
n
o
u
g
h
e
v
i
d
e
n
c
e
,
a
t
t
h
e
1
0
%
l
e
v
e
l
s
i
g
n
i
f
i
c
a
n
c
e
o
f
a
p
o
s
i
t
i
v
e
c
o
r
r
e
l
a
t
i
o
n
b
e
t
w
e
e
n
d
a
i
l
y
m
a
x
i
m
u
m
g
u
s
t
a
n
d
d
a
i
l
y
m
a
x
i
m
u
m
r
e
l
a
t
i
v
e
h
u
m
i
d
i
t
y
WB 15
An
engineer believes that there is a relationship between the CO
2
emissions and
fuel consumption for cars. A random sample of 40 different car models (old and new) was
taken and the CO
2
emission figures,
e
grams per kilometre, and fuel consumption,
f
miles
per gallon, were recorded.
The engineer calculates the pmcc for the 40 cars and obtains
r
= −0.803
a
)
S
t
a
t
e
w
h
a
t
i
s
m
e
a
s
u
r
e
d
b
y
t
h
e
p
r
o
d
u
c
t
m
o
m
e
n
t
c
o
r
r
e
l
a
t
i
o
n
c
o
e
f
f
i
c
i
e
n
t
.
b)
State, with a reason, whether a linear regression model based on these data is reliable or not for a
car when the fuel consumption is 60 mpg.
c)
For the linear regression model
e
= 198 − 1.71 ×
f
write down the explanatory variable.
d)
State the definition of a hypothesis test
e)
Test at 1% significance level whether or not the product moment correlation coefficient for CO
2
emissions and fuel consumption is less than zero. State your hypotheses clearly.
WB 15
ANSWERS
a)
State what is measured by the pmcc.
The Linear association between
e
and
f
.
Extrapolation, not reliable as
60 mpg is outside
the range of the given data
Explanatory variable is
Fuel consumption f
A test used to determine if there is
e
nough evidence in a
sample of data
to infer
That a certain condition is true for the
entire population
b)
State, with a reason, whether a linear regression
model based on these data is reliable or not for
a car when the fuel consumption is 60 mpg.
c)
For the linear regression model
e
= 198 − 1.71 ×
f
write down the explanatory variable.
d) State the definition of a hypothesis test
e)
Test at 1% significance level whether or
not the product moment correlation coefficient
for CO
2
emissions and fuel consumption is less
than zero. State your hypotheses clearly.
r
=
−
0
.
8
0
3
self-assess
One thing learned is –
One thing to improve is –
•
KUS objectives
BAT
use a hypothesis test to determine if the pmcc for
a sample indictates there is likely to be a linear
relationship in the population
END
Conducting hypothesis tests for zero correlation, analyzing PMCC values, determining critical values, and exploring relationships between variables in statistical data sets for research purposes.

Download Presentation

Please find below an Image/Link to download the presentation.
The content on the website is provided AS IS for your information and personal use only. It may not be sold, licensed, or shared on other websites without obtaining consent from the author.If you encounter any issues during the download, it is possible that the publisher has removed the file from their server.
You are allowed to download the files provided on this website for personal or commercial use, subject to the condition that they are used lawfully. All files are the property of their respective owners.
The content on the website is provided AS IS for your information and personal use only. It may not be sold, licensed, or shared on other websites without obtaining consent from the author.
E N D
Presentation Transcript
Hypothesis testing For zero correlation
Statistics: Pmcc and hypothesis tests BAT use a hypothesis test to determine if the pmcc for a sample indictates there is likely to be a linear relationship in the population KUS objectives Starter: interpret these results Data for daily rainfall in Perth in the LDS correlates to data for daily sunshine with a pmcc of ? = 0.68 Data suggests there may be a negative correlation Data for cloud cover in Beijing in the LDS correlates to data for humidity with a pmcc of ? = 0.02 Data suggests there may not be a correlation (what problems are there with data for cloud cover?) Data for daily sunshine in Heathrow in the LDS correlates to data for wind direction with a pmcc of ? = 0.54 Data suggests there may be a correlation However, common sense suggests we investigate further
Notes hypothesis testing for zero correlation For a one tailed test either ??: ? = ? ??: ? < ? ??: ? = ? ??: ? > ? or For a two tailed test ??: ? = ? ??: ? ? To find the Critical region: use the table of values in the formula booklet page 37 You need the significance level and the sample size The table gives the critical value between 0 and 1 (continuous data) So for a critical value between -1 and 0 we change sign on the value
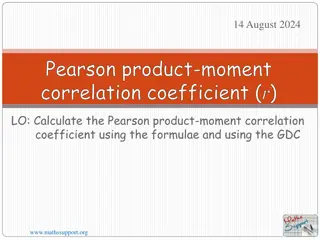
WB 12 A researcher wishes to investigate if there is a positive correlation between the number of vehicles and the number of road fatalities in European countries. He selects a random sample of 10 European countries and records the number of vehicles, v per 1000 people, and the number of road fatalities, r per 100 000 population, for a particular year. These are shown in the table and scatter diagrams. Country Austria Belgium France Germany Greece Ireland Italy Luxembou rg Spain UK v r 578 559 578 572 624 513 679 5.4 6.7 5.1 4.3 9.1 4.1 6.1 739 8.7 593 519 3.7 2.9 a What is the definition of a critical value? (1) b The product moment correlaton coefficient for v and r is 0.714. Use this value to test for positive correlation at the 5% significance level. Interpret your result in context. (3) c The researcher wishes to predict the number of road fatalities for a country with 650 vehicles per 1000 people. Write down the regression model he should use. (1) d State the dependent variable for the regression model in part c. e Monaco has 899 vehicles per 1000 people. Explain why the model stated in c is not reliable for estimating the number of road fatalities in Monaco. (1) (1)
WB 12 ANSWERS a What is the definition of a critical value? (1) A critical value is the point (or points) on the scale of the test statistic beyond which we reject the null hypothesis. b The product moment correlaton coefficient for v and r is 0.714. Use this value to test for positive correlation at the 5% significance level. Interpret your result in context. (3) H0 : ? = 0, H1 : ? > 0 There is evidence to reject H0 There is evidence that there is a positive correlation between the number of vehicles and road traffic accidents. 0.714 > 0.5494 (test statistic in critical region) Critical value = 0.5494 c The researcher wishes to predict the number of road fatalities for a country with 650 vehicles per 1000 people. Write down the regression model he should use. (1) ? = 7.0 + 0.02? d State the dependent variable for the regression model in part c. Road fatalities per 100 000 population (1) e Monaco has 899 vehicles per 1000 people. Explain why the model stated in c is not reliable for estimating the number of road fatalities in Monaco. (1) Outside the range of the data used in the model. (This would require extrapolation)
WB 13 A scientist takes 30 observations of the masses of two reactants in an experiment. She calculates a pmcc of ? = 0.45 The scientist believes there is no correlation between the masses of the two reactants. Test, at the 10% level of significance, the scientists claim, stating your hypothesis clearly H0 : ? = 0, H1 : ? 0 From the table in the formula booklet: Critical values of r for a 5% significance level are ? = 0.3061 sample size 30 two tailed The critical region is ? < 0.3061 ? > 0.3061 Since 0.45 < 0.3061 reject H0 There is evidence, at the 10% level significance that there is a correlation between the masses of the two reactants
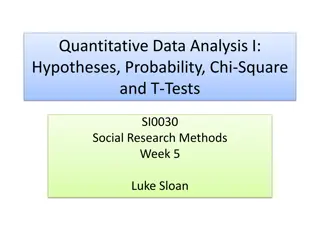
WB 14 data from the LDS is given in the table. X is daily maximum gust (kn) and Y is daily maximum relative humidity(%) in Leeming for a sample of eight days in May. X 31 28 38 37 Y 99 94 87 80 18 80 17 89 21 84 29 86 a) Find the pmcc for these data b) Test, at the 10% significance level, whether there is sufficient evidence of a positive correlation in the data. State your hypothesis clearly a) pmcc ? = 0.1149 b) H0 : ? = 0, H1 : ? > 0 sample size 8 one tailed From the table in the formula booklet: Critical values of r for a 10% significance level are ? = 0.5067 The critical region is ? > 0.5067 Since 0.1149 < 0.5067 not enough evidence to reject H0 There is not enough evidence, at the 10% level significance of a positive correlation between daily maximum gust and daily maximum relative humidity
WB 15 An engineer believes that there is a relationship between the CO2 emissions and fuel consumption for cars. A random sample of 40 different car models (old and new) was taken and the CO2 emission figures, e grams per kilometre, and fuel consumption, f miles per gallon, were recorded. The engineer calculates the pmcc for the 40 cars and obtains r= 0.803 a)State what is measured by the product moment correlation coefficient. b) State, with a reason, whether a linear regression model based on these data is reliable or not for a car when the fuel consumption is 60 mpg. c) For the linear regression model e= 198 1.71 f write down the explanatory variable. d) State the definition of a hypothesis test e) Test at 1% significance level whether or not the product moment correlation coefficient for CO2 emissions and fuel consumption is less than zero. State your hypotheses clearly.
WB 15 ANSWERS a) State what is measured by the pmcc. The Linear association between e and f. b) State, with a reason, whether a linear regression model based on these data is reliable or not for a car when the fuel consumption is 60 mpg. r= 0.803 Extrapolation, not reliable as 60 mpg is outside the range of the given data Explanatory variable is Fuel consumption f c) For the linear regression model e= 198 1.71 f write down the explanatory variable. d) State the definition of a hypothesis test A test used to determine if there is enough evidence in a sample of data to infer That a certain condition is true for the entire population e) Test at 1% significance level whether or not the product moment correlation coefficient for CO2 emissions and fuel consumption is less than zero. State your hypotheses clearly. ??: ? = ? ??: ? < ? ???????? ????? = 0.3665 0.803 Supports that the pmcc is negative
BAT use a hypothesis test to determine if the pmcc for a sample indictates there is likely to be a linear relationship in the population KUS objectives self-assess One thing learned is One thing to improve is