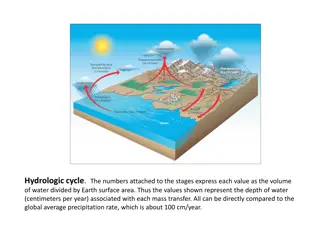
Hydrologic Studies and Watershed Analysis
This content covers topics such as volume/mass balance, hydrologic cycle, hydrologic budgets, climate change impact on watersheds, and practical hydrology knowledge essential for career development. It also addresses concerns, hopes, and resources related to studying hydrology, along with real-world applications such as streamstats and hydrologic data from USGS. Evaluate your understanding of topics like runoff ratio, forest area coverage, and per unit area flow through engaging visuals and questions.

Download Presentation

Please find below an Image/Link to download the presentation.
The content on the website is provided AS IS for your information and personal use only. It may not be sold, licensed, or shared on other websites without obtaining consent from the author.If you encounter any issues during the download, it is possible that the publisher has removed the file from their server.
You are allowed to download the files provided on this website for personal or commercial use, subject to the condition that they are used lawfully. All files are the property of their respective owners.
The content on the website is provided AS IS for your information and personal use only. It may not be sold, licensed, or shared on other websites without obtaining consent from the author.
E N D
Presentation Transcript
Recap Lecture 1 Volume/Mass balance (by GSL example) Units (interpretable, intuitive) Lecture 2 Hydrologic Cycle and Hydrologic budgets Watershed Climate change
Highlights from Information Sheets Never heard of Know of but not used Used a little Comfortable using 90% Expert Excel MATLAB R ArcGIS HEC-HMS HEC-RAS Canvas Other (you may think relevant) 5% 60% 5% 5% 40% 95% 85% 90% 90% 10% 5% 10% 5% 5% 75% 25% Smath, Epanet, Fortran, C++ were some mentioned
What do you hope to learn? Hydrology and solving hydrologic problems More about water and how it reacts and travels in and on the earth Practical knowledge to take into career Snow, Rain, Flooding Groundwater flow About the wonderful world of hydrology The reason I need to take it (Structures) Why water flows downhill (gravity) Don t know what hydrology is supposed to cover Air speed velocity of a raindrop Learn to solve the energy crisis
Worries Workload, homework, heard difficult, grade Having to memorize loads of equations Heard it is confusing So far no worries Failing I don t have a lot of time. I would like to get an A That I will need extensive programming to succeed I am terrified. Have not heard good things
Hydrologic Data and Hydrologic Budget USGS http://waterdata.usgs.gov
Streamstats http://water.usgs.gov/osw/streamstats/
Blacksmith Fork What is the area covered by forest in square miles 0.311*263 = 82 mi2 A. 50-70, B. 70-90, C. 90-110, D. More than 110, E. None of the above
Blacksmith Fork What is the per unit area flow in inches A. 0-3, B 3-5, C 5-7, D 7-9, E > 9
Blacksmith Fork What is the runoff ratio A. 0-0.2, B 0.2-0.4, C 0.4-0.6, D 0.6-0.8 E 0.8 - 1
Blacksmith Fork What happens to the rest of the water (majority) A. Evapotranspiration B. Infiltration C. Irrigation D. Groundwater E. Drinking by animals and people
A. Done Already B. Confident C. Could read text and figure out D. Unsure need help E. Clueless how to start
A. Done Already B. Confident C. Could read text and figure out D. Unsure need help E. Clueless how to start
Use the USGS NWIS website http://waterdata.usgs.gov/. For the gage you choose give the following a) Use computer screen captures to give a map showing the location of the gage you selected b) A hydrograph plot of streamflow at this stream gage (computer screen capture from website) c) Watershed area, d) Mean annual discharge, e) Months with highest and lowest mean of monthly discharges f) The maximum discharge on record and the date that this occurred g) The ratio of highest mean monthly discharge to lowest mean monthly discharge. Comment on the seasonal cycle of discharge at this gage. Compute the mean annual runoff expressed as a depth (yearly discharge volume/area). A. Done Already B. Confident C. Could read text and figure out D. Unsure need help E. Clueless how to start
A. Done Already B. Confident C. Could read text and figure out D. Unsure need help E. Clueless how to start
A. Done Already B. Confident C. Could read text and figure out D. Unsure need help E. Clueless how to start
A. Done Already B. Confident C. Could read text and figure out D. Unsure need help E. Clueless how to start
Groundwater Learning objectives Be able to quantify the properties of water held in and flowing through the subsurface (soil and rock). The properties of interest include porosity, moisture content, pressure, suction, hydraulic conductivity Mays Chapter 2
Schematic cross section illustrating unconfined and confined aquifers From Mays, 2011, Ground and Surface Water Hydrology
Example 2.2.1 An undisturbed sample of a medium sand weighs 484.68 g. The core is 6 cm in dia and 10.61 cm high. After oven drying the core weighs 447.32 g. Determine the bulk density, void ratio, water content and saturation percentage of the soil.
100 90 Gravel Clay Silt Sand Percentage finer by weight 80 70 60 50 40 30 20 10 0 0.001 0.01 0.1 1 10 100 Diameter (mm) Illustrative grain-size distribution curves. The boundaries between size classes designated as clay, silt, sand and gravel are shown as vertical lines.
Soil Texture Triangle From Mays, 2011, Ground and Surface Water Hydrology
Macroscopic and microscopic concepts of a porous medium. (from Freeze and Cherry, 1979)