Grand Rapids Cash Flow Forecast for General Depository
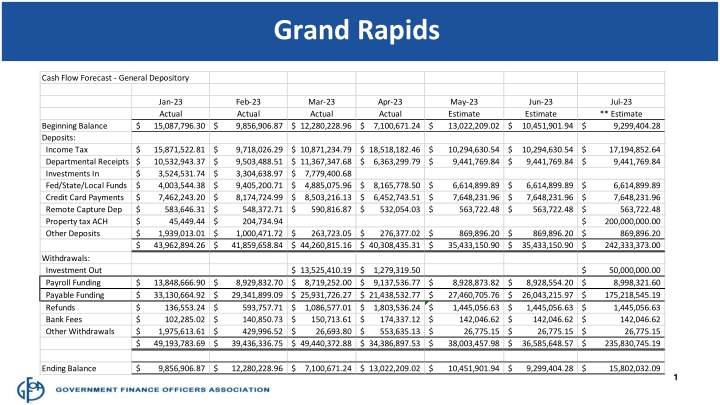
Cash flow forecast for Grand Rapids General Depository showing actual and estimated deposits, withdrawals, beginning balance, ending balance, payables funded, and payroll funded. The forecast includes actuals for Jan-Apr 2023 and estimates for May-Jul 2023. Payables are tied to the General Depository account with funding provided by transfers. The forecast also includes payroll funding details and property taxes. Detailed breakdown provided with insightful visuals.

Download Presentation

Please find below an Image/Link to download the presentation.
The content on the website is provided AS IS for your information and personal use only. It may not be sold, licensed, or shared on other websites without obtaining consent from the author.If you encounter any issues during the download, it is possible that the publisher has removed the file from their server.
You are allowed to download the files provided on this website for personal or commercial use, subject to the condition that they are used lawfully. All files are the property of their respective owners.
The content on the website is provided AS IS for your information and personal use only. It may not be sold, licensed, or shared on other websites without obtaining consent from the author.
E N D
Presentation Transcript
Grand Rapids Cash Flow Forecast - General Depository Jan-23 Actual 15,087,796.30 $ Feb-23 Actual 9,856,906.87 $ Mar-23 Actual 12,280,228.96 $ Apr-23 Actual 7,100,671.24 $ May-23 Estimate 13,022,209.02 $ Jun-23 Estimate 10,451,901.94 $ Jul-23 ** Estimate 9,299,404.28 $ Beginning Balance Deposits: Income Tax Departmental Receipts Investments In Fed/State/Local Funds Credit Card Payments Remote Capture Dep Property tax ACH Other Deposits 15,871,522.81 $ 10,532,943.37 $ 3,524,531.74 $ 4,003,544.38 $ 7,462,243.20 $ 583,646.31 $ 45,449.44 $ 1,939,013.01 $ 43,962,894.26 $ 9,718,026.29 $ 9,503,488.51 $ 3,304,638.97 $ 9,405,200.71 $ 8,174,724.99 $ 548,372.71 $ 204,734.94 $ 1,000,471.72 $ 41,859,658.84 $ 10,871,234.79 $ 11,367,347.68 $ 7,779,400.68 $ 4,885,075.96 $ 8,503,216.13 $ 590,816.87 $ 18,518,182.46 $ 6,363,299.79 $ 10,294,630.54 $ 9,441,769.84 $ 10,294,630.54 $ 9,441,769.84 $ $ $ 17,194,852.64 9,441,769.84 8,165,778.50 $ 6,452,743.51 $ 532,054.03 $ $ $ $ 6,614,899.89 7,648,231.96 563,722.48 6,614,899.89 $ 7,648,231.96 $ 563,722.48 $ 6,614,899.89 7,648,231.96 563,722.48 200,000,000.00 $ 869,896.20 $ 242,333,373.00 $ $ $ $ 263,723.05 $ 44,260,815.16 $ 276,377.02 $ 40,308,435.31 $ 869,896.20 35,433,150.90 $ $ 869,896.20 35,433,150.90 $ $ Withdrawals: Investment Out Payroll Funding Payable Funding Refunds Bank Fees Other Withdrawals 13,525,410.19 $ 8,719,252.00 $ 25,931,726.27 $ 1,086,577.01 $ 150,713.61 $ 26,693.80 $ 49,440,372.88 $ 1,279,319.50 $ 9,137,536.77 $ 21,438,532.77 $ 1,803,536.24 $ 174,337.12 $ 553,635.13 $ 34,386,897.53 $ $ $ 50,000,000.00 8,998,321.60 175,218,545.19 $ 1,445,056.63 $ 142,046.62 $ $ 235,830,745.19 $ 13,848,666.90 $ 33,130,664.92 $ 136,553.24 $ 102,285.02 $ 1,975,613.61 $ 49,193,783.69 $ 8,929,832.70 $ 29,341,899.09 $ 593,757.71 $ 140,850.73 $ 429,996.52 $ 39,436,336.75 $ $ 8,928,873.82 27,460,705.76 $ 1,445,056.63 $ 142,046.62 $ 26,775.15 $ 38,003,457.98 $ 8,928,554.20 $ 26,043,215.97 $ 1,445,056.63 $ 142,046.62 $ 26,775.15 $ 36,585,648.57 $ 26,775.15 Ending Balance 9,856,906.87 $ 12,280,228.96 $ 7,100,671.24 $ 13,022,209.02 $ 10,451,901.94 $ 9,299,404.28 $ $ 15,802,032.09 1
Grand Rapids Payables Funded line ties to the General Depository account line. Cash Flow Forecast - Payables As of April 30, 2023 Jan-23 Actual Feb-23 Actual Mar-23 Actual Apr-23 Actual May-23 Estimate Jun-23 Estimate Jul-23 ** Estimate Property Taxes 2,792,857.23 $ 175,218,545.19 $ (164,044,335.79) $ (12,804,539.23) $ 21,983.00 $ 1,184,510.40 $ Beginning Balance Payables Funded Checks Cleared ACH Payments Other Items (NSF etc) Ending Balance 5,699,620.29 $ 33,130,664.92 $ (17,583,518.27) $ (13,385,593.48) $ $ 7,861,173.46 $ 7,861,173.46 $ 29,341,899.09 $ (15,915,322.55) $ (12,065,226.38) $ 3,720.92 $ 9,226,244.54 $ 9,226,244.54 $ 25,931,726.27 $ (17,882,379.65) $ (13,914,994.12) $ (9,337.90) $ 3,351,259.14 $ 3,351,259.14 $ 21,438,532.77 $ (8,824,900.21) $ (11,844,026.11) $ 64,274.85 $ 4,185,140.44 $ 4,185,140.44 $ 27,460,705.76 $ (15,051,530.17) $ (12,802,460.02) $ 14,664.47 $ 3,806,520.48 $ 3,806,520.48 $ 26,043,215.97 $ (14,418,533.15) $ (12,656,676.66) $ 18,330.58 $ 2,792,857.23 $ - NOTE: Funding is provided by transfers from the General Depository and Investment accounts. July and August has a significant increase for property taxes. 2
Grand Rapids Payroll funded line ties to the General Depository line. City of Grand Rapids Cash Flow Forecast - Payroll As of April 30, 2023 Jan-23 Actual Feb-23 Actual Mar-23 Actual Apr-23 Actual May-23 Estimate Jun-23 Estimate Jul-23 ** Estimate 3% Contract Increase 2 Number of Payrolls 3 2 2 2 2 2 Beginning Balance Payroll Funding Payroll Checks/ACH Fed/State/City Taxes Checks Cleared Ending Balance 111,516.20 $ 13,848,666.90 $ (10,618,333.53) $ (3,227,869.60) $ (19,595.73) $ 94,384.24 $ 94,384.24 8,929,832.70 $ (6,401,955.77) $ (2,480,464.84) $ (3,812.14) $ 137,984.19 $ $ 137,984.19 $ 8,719,252.00 $ (6,461,304.32) $ (2,309,609.68) $ (1,457.91) $ 84,864.28 $ 84,864.28 9,137,536.77 $ (6,767,750.27) $ (2,368,864.66) $ $ 86,605.54 $ $ $ 86,605.54 8,928,873.82 $ (6,543,670.12) $ (2,386,313.06) $ (1,483.54) $ 84,012.64 $ 84,012.64 8,928,554.20 $ (6,590,908.24) $ (2,354,929.13) $ (707.34) $ 66,022.12 $ $ $ $ $ $ $ $ 66,022.12 9,196,410.82 (6,788,635.48) (2,425,577.01) (728.56) 47,491.89 819.42 NOTE: Payroll Funding is transferred from the General Depository or Investment Accounts. 3
Grand Rapids City of Grand Rapids Cash Flow Forecast - Liquid Cash and Investments As of May 1, 2023 5/1/2023 Actual 6/1/2023 Estimate 7/1/2023 Estimate Property Taxes 8/1/2023 Estimate 9/1/2023 Estimate Q4 2023 Estimate Q1 2024 Estimate Liquid Cash: Custodial MM Accts Water Bond Sewer Bond Street Lght Cap Imp Cemetery MM Cemetery CD Liquid Assets $140,414,677.66 = Liquid Funds 50,830,937.72 $ 2,061,937.32 $ 1,654,723.62 $ 4,603,679.35 $ 1,391,389.96 $ 2,259,028.71 $ 12,019,667.50 $ 74,821,364.18 $ 6,592,186.11 $ 6,592,186.11 $ $ $ - - 5,244,230.36 $ 5,244,230.36 $ 26,612,924.50 $ 26,612,924.50 $ 21,825,588.45 $ 21,825,588.45 $ 5,318,384.06 $ 5,318,384.06 $ 1-2 Years 2-3 Years 3-5 Years 5-7 Years 7-10 Years 10+ Years Total Long-Term Assets Yield to Maturity 81,053,573.14 $ 85,635,313.12 $ 116,193,758.74 $ 53,917,472.06 $ 43,021,363.83 $ 54,262,255.63 $ 434,083,736.52 $ 3.67% 4.22% 4.31% 4.31% 4.43% 4.01% 3.95% Unrealized Gain/(Loss) (1,984,644.20) $ (4,235,725.19) $ (7,261,793.88) $ (4,325,586.85) $ (3,598,007.72) $ (4,996,130.74) $ (26,401,888.58) $ 4
Grand Rapids Points to Consider July Property Tax Collection General Depository captures all deposits. Funds transferred to Payables, Payroll, and Investments. Notice major sources and uses of funds. Payable ending balance should tie to outstanding checks/ACH. Payroll ending balance should also tie to outstanding item list. Investment analysis of liquid versus long-term categories. Adjust course to changing conditions BE FLEXIBLE! 5