General Guidelines for this Template
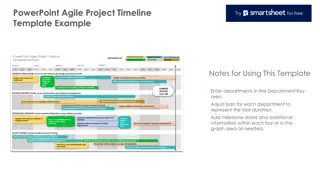
Guidelines for implementing a project management template, including stages like Define, Measure, Analyze, Improve, and Control. Tips on using tools effectively, customizing slides, and replacing logos.

Download Presentation

Please find below an Image/Link to download the presentation.
The content on the website is provided AS IS for your information and personal use only. It may not be sold, licensed, or shared on other websites without obtaining consent from the author.If you encounter any issues during the download, it is possible that the publisher has removed the file from their server.
You are allowed to download the files provided on this website for personal or commercial use, subject to the condition that they are used lawfully. All files are the property of their respective owners.
The content on the website is provided AS IS for your information and personal use only. It may not be sold, licensed, or shared on other websites without obtaining consent from the author.
E N D
Presentation Transcript
General Guidelines for this Template Add the letter of the stage (DMAIC) you are in on EACH SLIDE. Don t feel like you have to use the tools at the end of this slide deck. They are there for your convenience, not as requirements. Delete the slides you don t use, please. Replace the MSU logo with your own company s logo in the header 1
Insert Project Title Insert Company Name/Logo Project Leader: Project Champion: Project Team Members: 2
Define Measure Analyze Improve Control 3
Project Charter Insert completed project charter template of your choice DEFINE 4
Project Problem and Scope Problem Statement/Scope: EXAMPLE: Lower than expected billability, also described as Excessive Bench Capacity, results in chargeability variances and negatively impacts services margins by approximately $100,000,000 per year. DEFINE 5
Business Case Relevant Metrics: (Usually these are associated with quality- effectiveness, efficiency, time or cost.) Improvement Targets: EXAMPLE: 50% reduction in cycle time Increase System Availability from 88% to 98% Operational/Strategic Impact: EXAMPLE: $60,000 improvement to bottom line DEFINE 6
EXAMPLE of Business Case Operational and Strategic Impact: Hard Benefits: EXAMPLE: $145k or 1.82 FTE can be delivered in AMP from improved customer contact data. Wasted labor time spent in AMP on finding correct contact data for problem resolution estimated to be 5 min/defect on approx 1656 defects per month or $100k per annum. Wastage of labor in the customer satisfaction survey of 3 mins per defect or $24k per annum. Reduced wastage in billing disputes (125/month @ 15 mins each) or $20k per annum Soft Benefits: EXAMPLE: Improve customer satisfaction from less wrong contacts. Improved service performance through less time loss in tickets including wait time. DEFINE 7
Roles and Team Membership Project Champion or Sponsor: Project Team Leader or Black Belt: Project Team Members: Ad Hoc Members or SMEs: DEFINE 8
Project Plan 17-Mar 24-Mar 31-Mar 7-Apr 14-Apr 21-Apr 28-Apr 5-May 12-May 19-May 26-May 2-Jun 9-Jun Define 1-Apr Measure 9-Apr Analyze 1-May Improve 7-May Control 11-Jun DEFINE 9
Define Measure Analyze Improve Control 10
Baseline - EXAMPLE CURRENT GOAL COPQ: $1,177,000 COPQ: $588,500 PPM or DPMO: 572,840 PPM or DPMO: 286,420 Sigma Level: 1.29 Sigma Level: 2.05 MEASURE 11
Define Measure Analyze Improve Control 12
Define Measure Analyze Improve Control 13
Define Measure Analyze Improve Control 14
Project Results - EXAMPLE Baseline COPQ = $1,177,000 DPMO = 572,840 Sigma Level = 1.29 Goal COPQ = $588,500 DPMO = 286,420 Sigma Level = 2.05 Actual Achieved COPQ = $516,000 (i.e., saved more than goal) DPMO = 250,000 Sigma Level = 2.15 CONTROL 15
Project Results-Insert visual of some sort Confiscation of Errors on the Proposal Development 5 4 Process Change Implemented 3 2 1 0 Jul-03 Aug-03 Sep-03 Oct-03 Nov-03 Dec-03 Jan-04 Feb-04 Mar-04 Apr-04 May-04 Jun-04 Jul-04 Aug-04 CONTROL 16
The following slide needs to be in your presentation as the VERY LAST SLIDE in your PowerPoint. Replace the red words with your own project information and then change the font color to BLACK. Save your presentation with the following naming nomenclature: Last Name, First Name Company Name Project Title 17
Project Summary Problem Statement: In the last 3 months, 12% of our customers are late by over 45 days in paying their invoices. This represents 20% of our outstanding receivables and negatively affects our operating cash flow. Measured Metric to be Cycle Time Goal Reduce cycle time by 50% Baseline Target Realized Metrics 45 days 20 days 18 days Savings $482/day/process Annualized Savings $98,328 18
Extra Tool Slides Do NOT have to be used. Just for your convenience!
High Level Process Map (SIPOC) SIPOC DIAGRAM - High Level Cost Data Integrity Project SIPOC Help Supplier Input Process Output Customer Employees Contractors Employee Setup Data Contractor Setup Data Active Employee Record Active Contractor Record Project Manager and Team Project Manager and Team Setup Resources Employees & Contractors Contracting Officer Planning Meeting Statement of Work Project Schedule Project Schedule Project Manager and Team Project Manager and Team Assign Activities to Resources Payroll Department Contractors Employee Pay Rates Contractor Pay Rates Rate Table Rate Table System Administrator System Administrator Assign Rates to Resources Employees Contractors (Time & Materials) Timesheets Timesheets Labor Cost Report Labor Cost Report Project Manager and Team Project Manager and Team Enter Time Sheets Contractors (Fixed Priced) Invoices Contractor Cost Report Project Manager and Team Enter Vendor Invoices Project Management System Timesheet & Invoices Monthly Performance Reports CIO, Program Managers, VP Finance Summarize and Report Costs Instructions for Preparing the SIPOC Diagram: 1. Go through the process step by step, describing the major activities. List each of this activities under the Process column. 2. Add two columns, one to the left of the Process column Input and one to the right of the Process column Output. 3. Work to the left of each activity in the Process and describe the Input into this Activity. 4. Now work to the right of the activity in the Process and describe the Output from this Activity. 5. Add two more columns, one to the left of Inputs labeled Supplier and one to the right of Ouput labeled Customer. 6. Now work down the Input column and describe each source or supplier of the Input. 7. Do the same for the Output column and work down, describing who gets the output. Some points to consider: 1. The SIPOC Diagram should describe the existing process and not the "to be" process. 2. Have some Subject Matter Experts who know the process review the SIPOC Diagram for accuracy and completeness. 3. Include Sub-Processes and other key system interfaces within your SIPOC Diagram. 4. You can include additional descriptive information where appropriate such as applications involved, functional owners, etc. 5. If you need more detail, then create lower level SIPOC Diagrams. 20
Detailed Process Map Insert Swim Lane Flow Chart, if applicable WARP Implementation Close Problem Ticket Solution Accepted Customer Validate Customer Satisfaction Customer Support Services Approved Work Order or Approved Request Create Monet Ticket Service Delivery Coordinators Create Buy Ticket No Queue Coordination Billable Request? yes yes Update Ticket Resolve Request/ Verify Solution Assign Ticket Receive Equipment Technician Route Buy Ticket for Internal Approval Create P.O. MMO 21
Process FMEA Item Name: FMEA Team: Prepared by: Accounts Receivable FMEA Date (Orig): May 30, 2004 (Rev.): 11/15/2004 S E V O C C D E T R P N Key Process Input Actions Recommended Process Step Potential Failure Mode Potential Failure Effects Potential Causes Current Process Controls How Severe is effect cause likely to Risk Priority # to How frequent is How probable is to the customer? Detection of cause? What is the process step? What are the Key Process Inputs? (KPIV's) In what ways can Key Inputs go wrong? (Process fail to meet requirements) What is the impact on the Key Output Variables (customer requirements) or internal requirements? What causes the Key Input to go wrong? (How could the failure mode occur?) What are the existing controls that either prevent the failure mode from occurring or detect it should it occur? What are the actions for reducing the Occurrence of the cause, or improving Detection? Should have actions on high RPN's or Severity of 9 or 10. Occur? rank order concerns CFS rep. will monitor accounts at least weekly to determine risk and appropriate course of action if needed. SOP for the CFS rep., reporting plan and follow- up by supervision. CFS rep. does not monitor accounts on a timely basis, no SOP in place to set time frames for notification. Money is not collected on a timely basis, effecting cash flow and profitability. 8 Lack of training, performance expectations not set, no regular reporting system and lack of follow-up by supervision. 8 Data warehouse account receivables reports. These are not generated automatically but need to be requested by user. Weekly conference call with sales to discuss top ten delinquent accounts. None 8 512 All invoices are deemed past due after 30 days, even when different terms are specified in the contract No difference in the current process for channels of distribution or project type to reflect different contract terms Entering PO dollar information accurately. SOP for the CFS rep., reporting plan and follow- up by supervision. Customers are contacted even when not past due according to contract terms Customer satisfaction is lowered. Unnecessary time and effort by CFS rep. is spent following up on amounts not past due. 8 This policy has not been reviewed on a regular basis to update to reflect the current customer base 8 8 512 SOP for the CFS rep., reporting plan and follow- up by supervision. Contract terms vary to type of project and customer. Customer satisfaction is lowered. Unnecessary time and effort by CFS rep. is spent following up on amounts not past due. 8 This policy has not been reviewed on a regular basis to update to reflect the current customer base 8 None 7 448 Accurate Invoices Incorrect invoice entered into system. Customer will not pay inaccurate invoices on a timely basis. 8 Lack of training, performance expectations not set, no regular reporting system and lack of follow-up by supervision. 8 None 8 512 Frequency of customer contact SOP for the CFS rep., reporting plan and follow- up by supervision. No current standard work or SOP to specify standards for frequency of customer contact Money is not collected on a timely basis, effecting cash flow and profitability. 8 Lack of training, performance expectations not set, no regular reporting system and lack of follow-up by supervision. 8 No regular reporting and follow-up system established. 9 576 22
Validate Measurement System Insert Minitab Gage R&R Results 23
Process Capability Insert Minitab Capability Results 24
Pareto Diagram Order Prep Material Issues 100 80 70 80 60 Percent 60 50 Count 40 40 30 20 20 10 0 0 Non Masterbook Issues 13 15.5 100.0 Masterbook Issues 35 41.7 84.5 PO Issues Defect Count Percent Cum % 36 42.9 42.9 25
Cause-Effect Diagram Measurement Method Machine Clean out after grade change SOP for analytical lab where to take Tg on curve? Need to calibrate DSC Dryer down in plant Material prep for test Problem: Tg Shift Grade change in plant New technician in testing lab New lot of raws New operator in plant Power outage Out of spec raws Materials Man Mother Nature 26
Impact-Effort Matrix One person to quote Products made in house Quote sheet Training High Impact Single source Improve non-X service margins Low Low High Cost / Effort 27
Implementation Plan Task Status Start Date Finish Date Adjusted Date Task Description Resource Get Agreement on Proposal Meeting with management of business units B and F, as well as, representatives from the Project Management group to get agreement on proposal and set a start date for implementing recommendation. Smith Complete 4/13/16 4/21/16 Discuss Tools and Guidelines Meeting with Project Management group to discuss what types of feedback questions are asked currently. Write up a guidance document that may contain possible feedback questions and data analysis examples. Smith, Project Mgmt Group Represent atives In Process 4/21/16 4/26/16 Communicate System Communicate to business units B and F and upper management on new feedback rule Jones In Process 4/26/16 4/30/16 Monitor Effectiveness Obtain feedback data from next business process change to test whether the feedback loop helped in implementation process. Error Proofing Team Not Started 4/30/16 TBD 28
Control Plan Process Name: Processing of Expedite Orders Date: 4/14/2003 Recording of Measurement/ Tool Used Control Subject Subject Goals Unit of Meas. Measured by Whom Frequency of Measurement Sensor Sample Size Processing and Entry of Expedite Orders 90% on-time Entry of Expedite Orders % Expedite orders not entered before 12:30PM All Expedite Orders Sorter/ Supervisor Sorter Calculate Daily P-Chart Adequate Fax Machine paper level to print faxes No late orders due to fax machine out of paper Population (Two Fax Machines) N/A Sorter 4 Times per day N/A Sorter Adequate Fax Machine Toner level to print faxes No late orders due to fax machine out of toner. Sort and distribute all submitted Expedites every 30 min before 10:30AM. Every 15 min. 10:30 to 12:00 Population (Two Fax Machines) N/A Sorter 4 Times per day N/A Sorter Distribution of faxed expedite orders to XCC's 1 Delivery per 30 min, 1 Delivery per 15 Sorter stamps date/time of distribution on orders All Faxed Orders on two fax machines Elapsed Time Clock/Watch XCC's min. Return time of XCC indicated on message board for every absence >15 Usage of Message Board when XCC is not available Message board used per absence Check every fax distribution cycle All fax Sorter distribution cycles N/A Sorter min. XCC/Keyer enters with-in 30 minutes of receipt (delivery by Sorter) Whenever performance level drops below 90% on a given day Stamped time and Computer Entry Time Elapsed Time to Enter Order 30 Expedite Orders Data Collection Form Elapsed Time Supervisor 29
Communication Plan Where information is communicated--e.g. if during a standing meeting, which is the most appropriate forum? On Agenda Meeting set on individuals calendar (Mark when established) Level of communication-- Storyboard, paragraph update, tollgate summary Frequency of communication-- every other week, at tollgate, at end of project How information is communicated--1:1, meeting, email, newsletter Who is responsible for doing the communication? Dates for communication to occur Stakeholder CFO Champion Staff within departments represented on the team Managers who have staff represented on the project team Staff within the project department Executives Steering Committee Process Owners Overall Organization Individual responsible for validating project ROI (CFO, assigned analyst, etc.) 30


")