Gender Statistics Handbook in Ethiopia

FEDERAL DEMOCRATIC REPOBLIC OF ETHIOPIA
CENTRAL STATISTICAL AGENCY
GENDER STATISTICS HANDBOOK
2005/2012


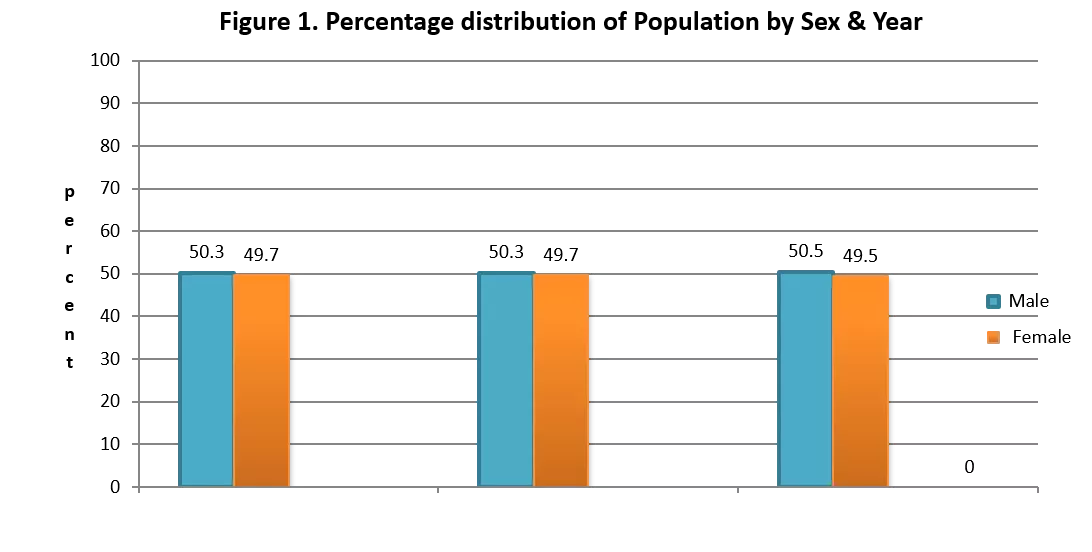
1. General demographic characteristics
Source: - Population and Housing census Statistical Report 1984, 1994 & 2007
According to the three Ethiopian census periods ( 1984,1994 and 2007) the percentage of male and
female population are almost similar ( 1984,1994 and2007).
Source: - Population and Housing census Statistical Report 1984, 1994 & 2007
Figure 2 shows that the percentage heads of conventional household males ‘ were grater than females
in the three census periods( 1984,1994 and2007).
Source: Analytical Report of Censuses in respect of population aged 10 years and above
Figure 3 indicates that young and old males are more dependent than young and old females
2. Education
Source: - Population and housing Census Statistical Report 1984, 1994 & 2007
In the previous two censuses the numbers of never school attended females were higher than males.
Source: - Population and housing Census Statistical Report 1984 and 1994
In the previous two census periods the gross enrollment ratio of male students in
rural area is higher than females in the secondary and primary schools.
Source: - Population and housing Census Statistical Report 1984 and 1994
The net enrollment ratios of males were grater than females in urban area of Ethiopia.
3. Health
Source: - EDHS 2011
The HIV Prevalence of women was greater than men (1.9 Vs 1).
Source: - Population and housing Census Statistical Report 1984, 1994 & 2007
In the last three censuses the majority of illiterate females are highly disabled than the
males.
4. Economic Participation
Source: - Population and housing Census Statistical Report 1984, 1994 & 2007
There is a huge difference in the economic participation of males and females In the last three census
periods. (1984, 1994 and 2007).
Source
: - Analytical Report on urban Employment Unemployment survey 2011
The economic activity rate of urban male population was grater than females in 2004,2006,2009,2010 and
2011.
Source
: Analytical Report on urban Employment Unemployment survey 2011
Overall in Ethiopia the male population employment was higher than the female once.
Source
: - Analytical Report on urban Employment Unemployment survey 2011
The illiterate and literate females who are unemployed were higher in number than the
males in Ethiopia.
5. Gender wealth gap
Source:- Central Statistical Agency Statistical Abstract 2011/12 Excluding Nomadic Areas
Males who acquired crop and livestock assets in the last three agricultural surveys where slightly higher
than females.
6. Crime
•
Source: - Statistical Abstract 2011/12 Central Statistical Agency
•
The people who are recorded in crime in Ethiopia is very high in the male once than females.
7. Decision Making
•
Source;- Ministry of women Children and youth affairs
•
The involvement and position of females in decision making are still very low in comparison of males
especially, on the ministerial level.
The Federal government employees those are getting a salary more than three thousand birr per month
the number of male and female are 76%and 24% respectively.
The proportion of male employees is 62.1% while the proportion of female employees is 37.9%.The
number of female is less than the number of male by 24%.
The marital status of Federal government employees 62.2% and 37.8% single employees are male and
female respectively. The proportion of married employees 64.8% is male and 35.2% is female.
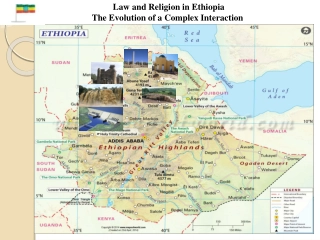
The Federal Democratic Republic of Ethiopia Central Statistical Agency presents data on population distribution by sex, household heads, dependency ratios, and education attendance status over three census periods. The figures highlight similarities and disparities between male and female demographics in various aspects of Ethiopian society.

Download Presentation

Please find below an Image/Link to download the presentation.
The content on the website is provided AS IS for your information and personal use only. It may not be sold, licensed, or shared on other websites without obtaining consent from the author.If you encounter any issues during the download, it is possible that the publisher has removed the file from their server.
You are allowed to download the files provided on this website for personal or commercial use, subject to the condition that they are used lawfully. All files are the property of their respective owners.
The content on the website is provided AS IS for your information and personal use only. It may not be sold, licensed, or shared on other websites without obtaining consent from the author.
E N D
Presentation Transcript
FEDERAL DEMOCRATIC REPOBLIC OF ETHIOPIA CENTRAL STATISTICAL AGENCY GENDER STATISTICS HANDBOOK 2005/2012
1. General demographic characteristics Figure 1. Percentage distribution of Population by Sex & Year 100 90 80 70 p e r c e n t 60 50.5 50.3 50.3 49.7 49.7 49.5 50 Male 40 Female 30 20 10 0 0 Source: - Population and Housing census Statistical Report 1984, 1994 & 2007 According to the three Ethiopian census periods ( 1984,1994 and 2007) the percentage of male and female population are almost similar ( 1984,1994 and2007).
Figure 2. Head of Conventional Households by sex & years 77.8 77.6 76.5 80 70 60 P e r c e n t 50 Male 40 Female 30 23.5 22.4 22.2 20 10 0 1984 1994 2007 Source: - Population and Housing census Statistical Report 1984, 1994 & 2007 Figure 2 shows that the percentage heads of conventional household males were grater than females in the three census periods( 1984,1994 and2007).
Figure 3. Dependency Ratio and AgePopulation Index in Census periods 100 89.9 92.5 90.2 90 84.5 83.8 80 80.5 70 60 Young Male Young Female 50 Old Male 40 Old Female 30 20 13.4 11.7 7.2 6.9 5.3 10 5.3 0 1984 1994 2007 Source: Analytical Report of Censuses in respect of population aged 10 years and above Figure 3 indicates that young and old males are more dependent than young and old females
2. Education Figure 4. prcentage distrubation of 5years old and over by school attendance status and year 100 90 82.86 80 p e r c e n t a g e 72.33 72.07 67.54 70 62.13 60 54.91 50 40 26.21 30 22.88 22.21 21.78 18.45 16.11 20 14.01 11.82 11.43 8.91 5.72 10 7.74 0 1984 1994 2007 Currently AttendingMale Currently Attending Female Attending in the PastMale Attending in the past Female Never Attend Male never Attend Female Source: - Population and housing Census Statistical Report 1984, 1994 & 2007 In the previous two censuses the numbers of never school attended females were higher than males.
140 Figure 5. Gross Enrollment Ratio by Sex 123.2 117.39 120 100 94.52 91.38 80.4 80 Primary School (1-8)1984 62 Primary School (1-8) 1994 60 48.4 General Secondary School (Old Curriculum 9-12)1984 General Secondary School (Old Curriculum 9-12)1994 46.81 37.86 40 19.12 18.37 20 9.97 6.1 1.72 1.7 0 Urban Male Urban Female Rural Male Rural Female Source: - Population and housing Census Statistical Report 1984 and 1994 In the previous two census periods the gross enrollment ratio of male students in rural area is higher than females in the secondary and primary schools.
Figure 6. Net Enrollment Ratio by sex 60 57.14 51.46 54.38 50 49.62 R 37.86 40 a t i 35 28.8 30 o 26.1 Male Urban 25.33 19.12 FemaleUrban 20 Male Rural Female Rural 10 5.78 2.1 1.04 4.07 0.71 0.9 0 Primary School (1- 8)1984 Primary school (1-8) 1994 General Secondary school (Old Curriculum (9-12)1984 General Secondary school (Old Curriculum (9-12)1994 Source: - Population and housing Census Statistical Report 1984 and 1994 The net enrollment ratios of males were grater than females in urban area of Ethiopia.
3. Health Figure 7. HIV Prevalence 6 5.2 5 4.2 4 P e r c e n t Ethiopia Urban 2.9 3 Rural 1.9 2 1.5 1 0.8 1 0.6 0.5 0 Women15-49 Men 15-49 Total 15-49 Source: - EDHS 2011 The HIV Prevalence of women was greater than men (1.9 Vs 1).
Figure 8 Percentage ditribution of Disabled Population by Litracy Status, Sex 90 83.07 80.4 80.07 80 70.09 70.09 65.4 70 60 P e r c e n t 1984 50 1994 40 34.6 34.6 2007 28.81 30 19.6 19.6 16.87 20 10 0 Litrate Male Litrate Female Illitrate Male Illitrate Female Source: - Population and housing Census Statistical Report 1984, 1994 & 2007 In the last three censuses the majority of illiterate females are highly disabled than the males.
4. Economic Participation Figure 9 Economic Participation Rate by Sex 90 82.12 79.2 75.1 80 63.4 70 62.86 55.5 60 R a t e Male 50 Female 40 30 20 10 0 1984 1994 2007 Source: - Population and housing Census Statistical Report 1984, 1994 & 2007 There is a huge difference in the economic participation of males and females In the last three census periods. (1984, 1994 and 2007).
Figure 10 Economic Activity Rate of Urban Population by Sex 67.9 67.2 70 66.1 65.7 61.2 60.3 59.7 59.4 58.6 60 55.2 53.7 53.5 53.1 52.2 49.9 50 P e r c e n t 40 Total Male 30 Female 20 10 0 2004 2006 2009 2010 2011 Source: - Analytical Report on urban Employment Unemployment survey 2011 The economic activity rate of urban male population was grater than females in 2004,2006,2009,2010 and 2011.
Figure 11 Employment to population Ratio by Sex 67.9 67.2 66.1 70 65.7 61.2 60 53.7 53.5 53.1 52.2 49.9 50 P e r c e n t 40 Male Female 30 20 10 0 2004 2006 2009 2010 2011 Source: Analytical Report on urban Employment Unemployment survey 2011 Overall in Ethiopia the male population employment was higher than the female once.
Figure 12 Unempolyment Rate by Literacy Status 45 41.5 40 37.1 35 31.6 29.6 28.2 P e r c e n t 30 27.3 25.3 Iilitrate Male 23.3 25 22.2 Iilitrate Female 20.1 19.2 18.4 Litrate Male 20 16.6 Litrate Female 13.2 13 15 12.7 12.4 11.9 11.5 11.2 9.2 10 7.7 7.6 5.9 5 0 2003 2004 2006 2009 2010 2011 Source: - Analytical Report on urban Employment Unemployment survey 2011 The illiterate and literate females who are unemployed were higher in number than the males in Ethiopia.
5. Gender wealth gap Figure 13 Percentage of holders by sex & Type of Holding 89.21 88.5 88.03 90 76.33 75.2 80 76.56 70 2001 male P e r c e n t 60 2001Female 50 2002Male 2002Female 40 2003Male 30 2003Female 15.9 15.35 15.34 20 8.96 8.8 8.42 8.4 8.31 8.1 10 3.1 3.01 2.37 0 Crop only Live stock Crop and livestock Source:- Central Statistical Agency Statistical Abstract 2011/12 Excluding Nomadic Areas Males who acquired crop and livestock assets in the last three agricultural surveys where slightly higher than females.
6. Crime Figure 14 Number of Crimes and Persons Recorded as Offenders by Sex and Years 1,000 Persons 350 314.3 277.9 300 250 Male 200 176.1 Female 148.2 Total 150 82.6 100 75.4 36.5 27.9 50 7.2 0 2000 2001 2003 Source: - Statistical Abstract 2011/12 Central Statistical Agency The people who are recorded in crime in Ethiopia is very high in the male once than females.
7. Decision Making 395 15. Empowerment 400 350 300 250 200 152 Men 150 111 65 100 Women 50 46 35 28 23 22 50 10 10 6 6 6 5 4 4 2 2 2 1 1 0 0 Source;- Ministry of women Children and youth affairs The involvement and position of females in decision making are still very low in comparison of males especially, on the ministerial level.
The percetage of Federal government employees the amount salary by sex 2012 Male Female 76 68 62.8 62.1 61.1 51.3 48.7 38.5 37.2 36.8 32.5 24 420-750 751-1000 1001-2000 2001-3000 3000 and above Total The Federal government employees those are getting a salary more than three thousand birr per month the number of male and female are 76%and 24% respectively.
The percentage of Federal government employees by sex in 2012 70 63.5 62.1 58.2 60 p e r c e n t a g e 50 41.8 37.9 40 36.5 Male Female 30 20 10 0 Permanent Temporary Total The proportion of male employees is 62.1% while the proportion of female employees is 37.9%.The number of female is less than the number of male by 24%.
The percentage of Federal government employees marital status by sex 2012 100 90 80 70 64.8 63.8 62.2 60 male 50 Female 37.8 36.2 40 35.2 30 20 10 0 Single Married Total The marital status of Federal government employees 62.2% and 37.8% single employees are male and female respectively. The proportion of married employees 64.8% is male and 35.2% is female.