Gender Representation in Lesotho's Local Government Elections
The decline in the proportion of women elected in Lesotho's local government elections from 49% in 2017 to 40% is a cause for concern, despite previous strides in gender equality. Efforts by civil society organizations and committees show progress, yet challenges remain. The legal framework in Lesotho supports gender equality, but recent election trends necessitate further attention to maintain and enhance women's representation in local governance.
Download Presentation

Please find below an Image/Link to download the presentation.
The content on the website is provided AS IS for your information and personal use only. It may not be sold, licensed, or shared on other websites without obtaining consent from the author.If you encounter any issues during the download, it is possible that the publisher has removed the file from their server.
You are allowed to download the files provided on this website for personal or commercial use, subject to the condition that they are used lawfully. All files are the property of their respective owners.
The content on the website is provided AS IS for your information and personal use only. It may not be sold, licensed, or shared on other websites without obtaining consent from the author.
E N D
Presentation Transcript
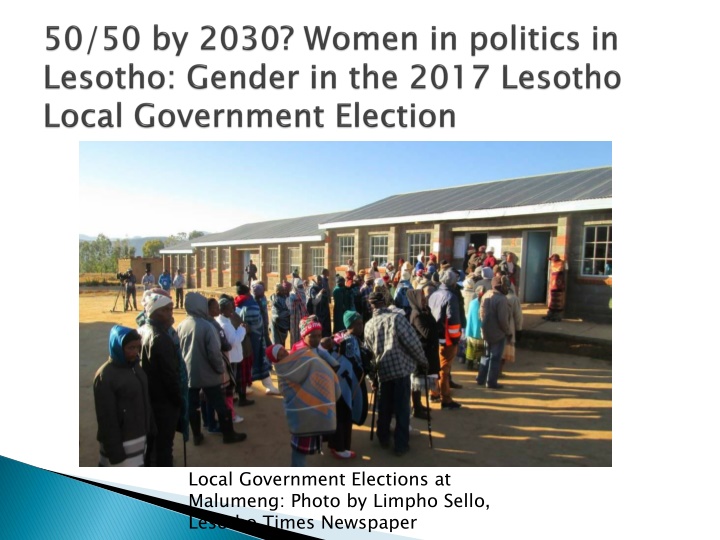
Local Government Elections at Malumeng: Photo by Limpho Sello, Lesotho Times Newspaper
The proportion of women elected in the September 2017 Local Government elections in Lesotho decreased from 49% to 40%. The first Lesotho local government elections saw the highest representation of women in the SADC region at 58%. This was due to the legislated quota where 30% of the constituencies were reserved for women. However this was challenged and abundant in 2011 where there was a 9% decrease in the representation of women. 2017 has seen a further decrease by 9 percentage points. The system that was used for the 2017 elections is the reserved proportional representation seats as it was in the 2011 elections.
70% 60% 50% 40% 2005 2011 30% 2017 20% 10% 0% women in local government
Lesotho 2017 Local Government Results Total number of Councillors by sex and by % All Councilors women 193 346 539 47 47 94 24 19 43 179 179 358 33 40 73 16 28 44 10 10 20 FPTP Results for Men and Women Councilors Women reserved seats POLITICAL PARTY ABC AD BNP DC LCD MEC PFD % of % of Women % of Women Women Men Women Men Total Women 36% 50% 56% 50% 45% 36% 50% 80 11 346 47 19 179 40 28 10 426 58 25 253 48 29 14 19% 19% 44% 29% 17% 3% 29% 113 36 18 105 25 15 36% 11% 6% 33% 8% 5% 2% 6 74 8 1 4 7 Other Parties 1 2 3 25% 1 2 3 33% 0 0 INDEPENTS 11 76 87 13% 11 59 87 16% - - ELECTED CHIEFS 45 104 149 30% - - - - - Total % 559 40% 851 60% 1410 100% 192 20% 735 79% 944 100% 319 100% 40% 20% 100%
A total of 1410 Councillors were elected in the September 2017 polls. This number is made up of men and women elected through the FPTP seats, special reserved seats for women and elected chiefs. Of the total number of councillors, women make up 40% while men make 60%.
There has been progress with respect to gender representation at the local government level. Efforts of civil society organisations, MGYSR, the Gender Technical Committee (GTC) amongst others are evidence of this. However the drop that has been experienced in the last two elections call for concern.
Overall it is evident that Lesotho has the legal frameworks in place to make huge strides in gender equality in local government. The challenges however remain at party level as well as in the mind-set of the people to attain the regional standards. A possibility to ensure political parties set quotas for their women members may possibly lie with the SADC Secretariat or the Gender Unit. Only by compelling political parties regionally to comply with a regional standard will we see parties select more women to stand for elections, especially in the non-reserved seats.
KEA LEBOHA KHOTSO PULA NALA
