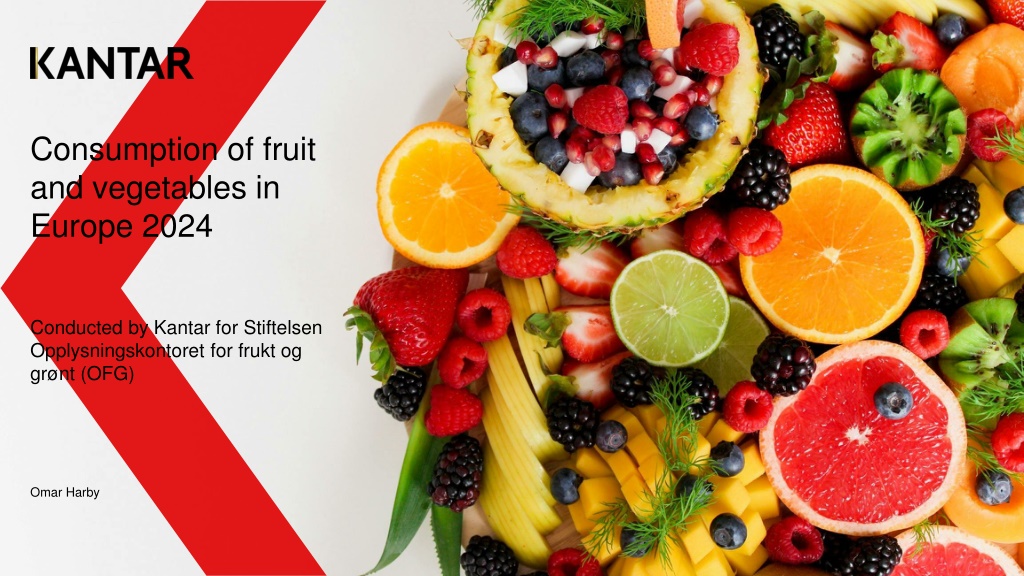
Fruit and Vegetable Consumption Trends in Europe 2024
The survey conducted by Stiftelsen Opplysningskontoret for frukt og grønt (OFG) presents insights on fruit and vegetable consumption in European countries, highlighting how UK citizens consume more fruit and berries daily compared to others. The report includes data on portion sizes, daily consumption habits, and comparisons among different countries in Europe.

Download Presentation

Please find below an Image/Link to download the presentation.
The content on the website is provided AS IS for your information and personal use only. It may not be sold, licensed, or shared on other websites without obtaining consent from the author. Download presentation by click this link. If you encounter any issues during the download, it is possible that the publisher has removed the file from their server.
E N D
Presentation Transcript
Consumption of fruit and vegetables in Europe 2024 Conducted by Kantar for Stiftelsen Opplysningskontoret for frukt og gr nt (OFG) Omar Harby
ABOUT THE SURVEY The foundation Opplysningskontoret for frukt og gr nt (OFG) has since 2017 conducted a yearly study to measure the consumption of fruit, berries and vegetables in various European countries. This survey has been repeated in 2024. Several questions have been included in the Norwegian survey, i.a. related to children's consumption, consumption of fruit and vegetables and some questions about price, since food prices are now rising. This report includes the main results from the European countries, where less questions were asked than in the Norwegian survey. A separate report deals with the questions about the use of fruit and vegetables in Norway. The results are weighted by gender, age and education. METHODOLOGY FIELD PERIOD SAMPLE Web survey 05.09.24 20.09.24 National representative sample in each country 18+ years old 9034 interviews
ONE PORTION Fruit and berries One portion of fruit and berries is more or less a handful. It can be a medium-sized fruit such as an apple, banana or pear, or a piece of a large-sized fruit as melon, pineapple or mango. It could also be a handful of small-sized fruits like grapes, plums, kiwi or a handful of berries. We are thinking of fruit/berries in all formats: fresh, frozen, canned, in homemade smoothies etc. Vegetables and salad One portion is more or less a handful vegetables and salads. One portion could include a big tomato, seven cherry tomatoes, a carrot, a handful of broccoli or a small bowl of salad. Please consider vegetables and salads of all formats: fresh, frozen, canned, fried, in homemade smoothies etc. Juice (not nectar) A glass of juice is about 2 dl. Please think about pure fruit- and/or vegetable juice, not nectar or other not pure juice products. One portion is defined as 1 dl or half a glass of juice. Smoothie (bought, not homemade) A glass of smoothie is about 2 dl. Think of any type of smoothie you can buy made from fruit and/or vegetables. One portion is defined as 1 dl or half a glass of smoothie.
CONSUMPTION Consumption of fruit/berries and vegetables in day-to-day life
Portions of fruit and berries daily How many portions of fruit and berries do you usually eat? UK CITIZENS STILL EAT MORE FRUIT AND BERRIES DAILY COMPARED TO OTHER EUROPEAN COUNTRIES UK 5 5 14 20 18 29 8 Spain 3 4 16 23 27 24 4 France 3 4 10 21 26 27 8 Norway 2 4 11 19 23 36 6 Eating at least one portion of fruit and berries each day, is most common in Spain and Italy. 73% report eating at least one portion of fruit and berries each day in Spain, and 68% report the same in Italy. Finland 3 4 8 20 21 37 8 Italy 1 2 11 29 25 25 6 Germany 2 1 8 19 27 36 6 Only half of the sample in Sweden say they eat a portion of fruit and berries at least once a day. Netherlands 0 2 6 21 29 33 8 Denmark 1 2 6 14 21 42 14 Sweden 1 2 5 15 27 40 10 5 portions per day + 3 portions per day 1 portion per day Less than one portion per week/never 4 portions per day 2 portions per day 1-6 portions per week
Portions of vegetables or salad (ex. potatoes) daily How many portions of vegetables or salad (ex. potatos) do you usually eat? THE UK IS ALSO AT THE TOP WHEN IT COMES TO EATING VEGETABLES DAILY UK 4 5 14 24 21 26 6 France 4 4 8 24 29 28 3 Norway 2 3 9 21 31 32 2 23% of the UK sample say they eat at least three portions of vegetables each day. Spain 3 3 8 23 29 33 2 Denmark 2 3 8 15 25 39 7 Italy has the highest share of respondents who eat at least one portion of vegetables each day (72%) but has fewer respondents who eat at least three portions of vegetables daily. Finland 2 3 8 23 27 34 4 Germany 2 2 8 18 28 40 2 Netherlands 2 3 5 21 34 32 4 Italy 1 2 7 29 33 27 2 Sweden 1 1 5 22 31 36 3 5 portions per day + 3 portions per day 1 portion per day Less than one portion per week/never 4 portions per day 2 portions per day 1-6 portions per week
Glasses of juice (not nectar) daily How many glasses of juice (not nectar) do you usually drink? THE NORDIC COUNTRIES DRINK SIGNIFICANTLY LESS JUICE THAN THE REST OF EUROPE. France 2 3 5 13 28 22 28 UK 3 3 4 11 25 25 30 Germany 2 2 5 12 17 27 35 50% of France drink at least one glass of juice each day, compared to 13% in Denmark. Spain 2 2 5 10 23 25 33 Netherlands 2 2 4 8 15 26 43 Italy 1 2 4 10 21 31 31 Finland 1 2 7 16 30 45 Denmark 1 1 2 9 27 60 Sweden 1 3 12 23 61 Norway 0 0 1 4 14 33 47 5 portions per day + 3 portions per day 1 portion per day Less than one portion per week/never 4 portions per day 2 portions per day 1-6 portions per week
Glasses of smoothie daily How many glasses of smoothie (bought in a store not homemade) do you usually drink? THE NORDIC COUNTRIES ALSO DRINK SIGNIFICANTLY LESS SMOOTHIE DAILY THAN THE REST OF EUROPE Spain 1 2 4 7 12 17 57 Germany 1 2 4 6 11 12 64 UK 1 1 4 7 13 16 58 France 1 2 3 8 9 10 68 7% of the sample drink at least three portions of smoothie each day in Spain and Germany. Netherlands 1 2 6 8 16 67 Italy 1 1 2 6 13 19 59 Finland 0 1 2 2 12 82 Norway 1 1 2 8 88 Denmark 1 6 91 Sweden 1 1 4 93 5 portions per day + 3 portions per day 1 portion per day Less than one portion per week/never 4 portions per day 2 portions per day 1-6 portions per week
Total consumption of fruits and vegetables daily UK 37 12 14 23 10 2 2 Italy 26 16 19 28 9 2 0 THE TOTAL CONSUMPTION OF FRUIT AND VEGETABLES VARIES BETWEEN THE EUROPEAN COUNTRIES Spain 31 12 18 25 12 1 1 France 31 13 16 25 11 3 1 Norway 25 12 15 26 19 2 1 37% of UK citizens eat at least five portions of fruit and vegetables each day. Germany 22 10 19 29 17 2 1 Scandinavians eat less fruit and vegetables daily compared to other Europeans. The only exception is Norway, where 1/4 of the population eat at least five portions of fruit and vegetables each day. Netherlands 18 11 21 29 17 3 1 Finland 23 12 15 29 17 2 2 Sweden 13 11 16 28 25 5 2 Denmark 16 10 13 24 27 6 4 5 portions per day + 3 portions per day 1 portion per day Less than one portion per week/no portions 4 portions per day 2 portions per day 1-6 portions per week
Daily consumption The percentage who eats at least 5 portions of fruit/berries or vegetables every day Mean daily consumption of fruit/berries and vegetables 4.0 38.4 3.7 3.7 3.5 3.3 3.3 32.4 3.2 31.7 3.1 27.0 2.7 2.7 24.5 23.7 22.9 18.8 17.3 13.5 Calculation: Consumption of juice and smoothie counts for maximum one portion a day. Those who answer: I don t know , and those who haven t given an answer to how many fruits/berries/vegetables/drinks they eat/drink are excluded from the calculation.
The percentage who eats at least 5 portions of fruit/berries or vegetables every day development over time 46 43 40 39 38 38 37 34 33 33 32 32 31 29 29 29 28 27 27 27 26 25 25 24 23 22 22 22 20 20 20 19 19 19 19 18 18 18 18 18 17 17 16 14 14 13 13 13 13 12 UK France Spain Italy Norway Finland Germany Netherlands Denmark Sweden 2020 2021 2022 2023 2024 Calculation: Consumption of juice and smoothie counts for maximum one portion a day. Those who answer: I don t know , and those who haven t given an answer to how many fruits/berries/vegetables/drinks they eat/drink are excluded from the calculation.
Mean daily consumption of fruit/berries and vegetables Development over time 4.4 4.3 4.1 4.1 4.1 4.1 4.0 4.0 3.9 3.8 3.8 3.7 3.7 3.7 3.6 3.6 3.6 3.5 3.5 3.5 3.5 3.4 3.3 3.3 3.2 3.2 3.2 3.2 3.1 3.1 3.1 3.1 3.1 3.0 3.0 3.0 3.0 2.9 2.9 2.9 2.9 2.9 2.7 2.7 2.7 2.7 2.6 2.6 2.5 2.5 UK France Spain Italy Norway Finland Germany Netherlands Sweden Denmark 2020 2021 2022 2023 2024 Calculation: Consumption of juice and smoothie counts for maximum one portion a day. Those who answer: I don t know , and those who haven t given an answer to how many fruits/berries/vegetables/drinks they eat/drink are excluded from the calculation.
SUMMARY Eating at least five portions of fruit and vegetables each day is most common in the UK but the share has decreased significantly since 2020. The Nordic countries drinks less juice and smoothie than the rest of Europe. There s an increase in the share who eat at least five portions of fruit and vegetables every day across most of Europe the only exception being the UK, Denmark and the Netherlands. The biggest increase from 2022 happened in Norway (+6 pp), Germany (+5 pp) and Spain (+4 pp). The mean consumption of fruit and vegetables is, on the other hand, more stable across Europe, with few changes from last year.


 daily")
 daily")