Fresh Mushrooms Sales Trends in Retail Market
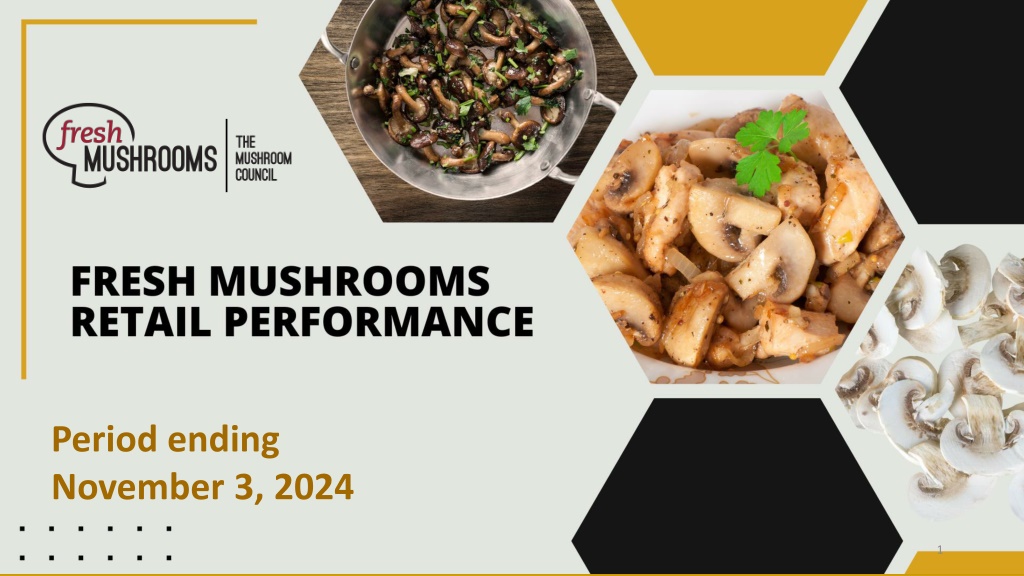
Explore the recent trends in fresh mushrooms sales over a four-week period ending November 3, 2024. Dive into dollar sales, unit sales, volume trends, and mushroom's contribution to the total vegetable market. Contact Anne-Marie Roerink for more information.

Download Presentation

Please find below an Image/Link to download the presentation.
The content on the website is provided AS IS for your information and personal use only. It may not be sold, licensed, or shared on other websites without obtaining consent from the author. If you encounter any issues during the download, it is possible that the publisher has removed the file from their server.
You are allowed to download the files provided on this website for personal or commercial use, subject to the condition that they are used lawfully. All files are the property of their respective owners.
The content on the website is provided AS IS for your information and personal use only. It may not be sold, licensed, or shared on other websites without obtaining consent from the author.
E N D
Presentation Transcript
Period ending November 3, 2024 1
Methodology The report covers the four weeks ending November 3, 2024 with week endings: October 13, 2024 October 20, 2024 October 27, 2024 November 3, 2024 Dollar references are the retail value, volume is reflected in pounds and units (packages) Package size, organic, fixed/random weight and value-added now all reflect the MULO+ expanded marketplace For questions, contact Anne-Marie Roerink, at aroerink@210analytics.com Source: Circana, Integrated Fresh, MULO+, 4 weeks ending 11/3/2024 2
Four-year dollar sales trend Dollar sales are down about $6 million from 2-3 years ago in the four-week view Fresh mushrooms dollar sales latest 52 w.e. 11/3/2024 Fresh mushrooms dollar sales four w.e. 11/3/2024 $1,599,226,629 $1,563,957,816 $1,553,335,252 $118,319,340 $118,149,490 $1,524,537,259 $114,129,972 $112,288,193 3YA 2YA YA 4 w.e. 10/6/24 3YA 2YA YA 52 w.e. 10/6/24 Source: Circana, Integrated Fresh, MULO+, 4 weeks and 52 w.e. 11/3/2024 versus same periods the past four years 3
Four-year unit sales trend Unit sales declined more than volume, given the strength in 24-ounce packages Fresh mushrooms unit sales four w.e. 11/3/2024 Fresh mushrooms unit sales latest 52 w.e. 11/3/2024 42,034,380 39,362,128 38,353,573 36,971,330 581,188,849 533,931,498 515,973,577 502,080,551 3YA 2YA YA 4 w.e. 10/6/24 3YA 2YA YA 52 w.e. 10/6/24 Source: Circana, Integrated Fresh, MULO+, 4 weeks and 52 w.e. ending 11/3/2024 versus same periods the past four years 4
Four-year volume (pound) sales trend In the quad-week period, pound sales trended within 1 million pounds of last year Fresh mushrooms volume sales latest 52 w.e. 11/3/2024 Fresh mushrooms volume sales four w.e. 11/3/2024 27,669,434 26,012,971 25,343,585 24,600,048 385,349,503 354,103,775 343,558,167 334,701,629 3YA 2YA YA 4 w.e. 10/6/24 3YA 2YA YA 52 w.e. 10/6/24 Source: Circana, Integrated Fresh, MULO+, 4 weeks and 52 w.e. ending 11/3/2024 versus same periods the past four years 5
Mushroom contribution to the department and category The mushroom share of total vegetable sales remained steady in the quad week 4 weeks Mushroom $ share Share of total produce Share of total vegetables 52 weeks Mushroom $ share Share of total produce Share of total vegetables 3YA 3YA 1.98% 3.86% 1.98% 4.03% 2YA 2YA 1.87% 3.58% 1.81% 3.76% YA YA 1.76% 3.49% 1.74% 3.60% 4 w.e. 11/3/2024 52 w.e. 11/3/2024 1.67% 3.38% 1.65% 3.49% Source: Circana, Integrated Fresh, MULO+, 4 weeks and 52 w.e. ending 11/3/2024 6
Mushrooms price per unit On a per unit basis, vegetable prices were flat while mushroom prices saw a 2.1% uptick in the latest four weeks due to the switch to larger packages 4 weeks Average price/unit Total produce Total vegetables Mushrooms 3YA $2.53 $2.30 $2.81 2YA $2.68 $2.50 $3.00 YA $2.76 $2.47 $2.98 4 w.e. 11/3/2024 $2.78 | +0.9% $2.47 | +0.1% $3.04 | +2.1% Source: Circana, Integrated Fresh, MULO+, YTD weeks ending 11/3/2024 7
Mushroom price per volume (pound) On a per pound basis, mushroom prices increased 1.3% 4 weeks Average price/pound Total produce Total vegetables Mushrooms 3YA $1.66 $1.62 $4.28 2YA $1.77 $1.78 $4.54 YA $1.80 $1.75 $4.50 4 w.e. 11/3/2024 $1.81 | +0.3% $1.73 | -0.9% $4.56 | +1.4% Source: Circana, Integrated Fresh, MULO+, YTD weeks ending 11/3/2024 8
Price per volume by quarter/month Prices have been rising over the past few months, matching their highest point during the fourth quarter of 2022 Mushrooms price per pound and change vs. YA (fixed and random weight) $4.70 9.0% $4.56 $4.54 $4.56 $4.56 $4.57 $4.53 $4.48 $4.51 $4.54 $4.60 $4.52 8.0% $4.44 $4.50 7.0% $4.33 $4.40 6.0% 7.9% 7.9% $4.30 5.0% 6.4% 5.2% $4.18 $4.20 4.0% 4.5% $4.09 3.5% $4.10 3.0% $3.95 $4.00 2.0% 2.1% $3.90 1.0% 1.4% 1.0% 1.3% $3.80 1.0% 0.0% 0.7% -0.1% $3.70 -1.0% -0.8% Q4 23 $3.60 -2.0% 2019 2020 2021 Q1 22 Q2 22 Q3 22 Q4 22 Q1 23 Q2 23 Q3 23 Q1 24 Q2 24 Q3 24 4 w.e. 11/3/24 Source: Circana, Integrated Fresh, MULO+, 2019-w.e. 11/3/2024 9
Price by type 4 w.e.11/3/2024 Price per unit % change vs. YA % change vs. 3YA Total mushrooms $3.04 +2.1% +7.9% White mushrooms $2.65 +1.2% +7.3% Brown mushrooms $3.25 +1.8% +6.4% Specialty mushrooms $6.26 +5.2% +7.5% 4 w.e. 11/3/2024 Price per volume % change vs. YA % change vs. 3YA Total mushrooms $4.56 +1.4% +6.7% White mushrooms $3.99 +0.3% +6.6% Brown mushrooms $4.72 +1.4% +4.5% Specialty mushrooms $13.94 -2.1% +4.4% Brown mushrooms include crimini and portabella Specialty mushrooms include shiitake, oyster, enoki, chanterelle, morel, wood ear, porcini, black forest, lion s mane and other Source: Circana, Integrated Fresh, MULO+, 4 w.e. 11/3/2024 10
Mushroom dollar, unit, volume sales Dollar and volume sales are starting to level off, driven by 24-ounce packages 4 w.e. 11/3/2024 dollars $112.3M -1.6% -3.6% -2.9% Dollar Unit Volume growth vs. YA growth vs. YA growth vs. YA volume (lbs) 25.3M -5.0% vs. 2YA -5.1% vs. 3YA -5.4% vs. 2YA -11.1% vs. 3YA -6.1% vs. 2YA -12.0% vs. 3YA Source: Circana, Integrated Fresh, MULO+, 4 weeks ending 11/3/2024 11
Vegetables and mushroom pound sales vs. YA Vegetables continue to have a strong 2024 Volume (pound) sales versus year ago Fresh vegetables vs YA Fresh mushrooms vs. YA 19.0% 15.5% 3.9% 2.8% 2.4% 1.6% 1.3% 1.0% 0.3% -0.7% -1.2% -2.3% Q3 '22 -1.0% Q2 '22 2020 2021 Q1 '22 Q4 '22 Q1 '23 Q2 '23 Q3 '23 Q4 '23 Q1 '24 Q2 '24 Q3' 24 4 w.e. 11/3/24 -1.4% -1.6% -2.1% -2.0% -3.6% -2.9% -4.4% -5.2% -4.6% -4.0% -4.8% -2.9% -7.3% -9.1% -8.6% Source: Circana, Integrated Fresh, MULO+, 2020 -w.e. 11/3/2024 12
Share of dollars sold on merchandising Promotional levels increased during the past year but were down over the latest quad-week period Fresh mushrooms 4 w.e. Vs. YA Latest 52 w.e. 11/3/2024 Vs. YA 11/3/2024 Share of dollars sold on promotion 20.1% -6.9% 17.8% +5.0% * Any merchandising, including feature, display, feature & display and temporary price reductions Source: Circana, Integrated Fresh, MULO+, latest 4 w.e. 11/3/2024 13
Over indexing versus under indexing regions In dollars, the Northeast is an above-average seller and had better-than-average growth. In the four-week view, the Southeast was impacted by the hurricanes Use as comparison to understand importance/size of mushrooms L-52 w.e. 11/3/2024 Share of veg. $ Share of mushrooms $ $ sales growth WEST WEST PLAINS PLAINS vs. YA GREAT LAKES GREAT LAKES Total US California Great Lakes Mid-South Northeast Plains South Central Southeast West 100.0% 12.1% 13.3% 13.0% 17.6% 6.6% 8.9% 15.5% 13.1% 100.0% 14.1% 15.0% 11.4% 17.5% 6.4% 6.8% 13.4% 15.4% -1.9% -2.7% -2.2% -1.3% -1.3% -2.3% -3.6% -0.9% -1.6% NORTHEAST NORTHEAST MID SOUTH MID SOUTH CALIFORNIA CALIFORNIA SOUTHEAST SOUTHEAST SOUTH CENTRAL SOUTH CENTRAL = Above-average share vs. veg = Above-average performance vs. total US Source: Circana, Integrated Fresh, MULO+, L52 w.e. 11/3/2024 | Total fresh vegetables and total fresh mushrooms 14
Performance summary whites, browns and specialty Crimini and specialty mushrooms had the strongest performance in the short and longer term Dollar share $ sales vs. $ sales vs. 3YA Volume (lbs) Lbs Lbs Lbs vs. 3YA 4 weeks ending 11/3/2024 Dollars YA share vs. YA $112.3M 100% -1.6% -5.1% 24.6M 100% -2.9% -11.1% Total fresh mushrooms $55.7M 48.7% -2.7% -9.5% 13.7M 55.7% -3.0% -15.1% White mushrooms $40.1M 35.7% -2.0% +4.6% 8.7M 35.2% -3.1% -1.5% Crimini mushrooms $8.2M 7.3% -4.0% -24.5% 1.6M 6.4% -6.7% -24.8% Portabella mushrooms $9.4M 8.4% +10.0% +6.2% 0.7M 2.7% +12.3% +1.7% Specialty mushrooms Source: Circana, Integrated Fresh, MULO+, 4 weeks ending 11/3/2024 15
Other insights Packaged (fixed weight) versus random weight Package-size analysis Organic versus conventional Value-added versus whole/uncut 16
Package size analysis 8-ounce packs drove the bulk of sales but 24-ounce packages have overtaken 16-ounce packages with growth in dollars, units and volume Package size (per UPC) 52 weeks Dollars $ vs. YA Units % vs. YA Volume lbs vs. YA 8 OZ $735.6M -1.7% 312.9M -1.9% 156.5M -2.0% 16 OZ $237.2M -5.4% 58.4M -8.8% 58.4M -8.8% 24 OZ $242.4M +1.1% 46.5M +2.2% 71.3M +2.2% Source: Circana, Integrated Fresh, MULO+, 52 weeks ending 11/3/2024 17
Packaged (fixed weight) versus random weight Fixed-weight dollar sales outperformed random weight 52 w.e. 11/3/2024 | Share of total mushroom sales and sales growth % Fixed weight Random weight Dollar growth -1.7% -4.9% Share of mushroom $ sales 96.6% -2.6% 3.4% -3.4% Volume growth Share of mushroom lbs sales 97.0% 3.0% Source: Circana, Integrated Fresh, MULO+, 4 weeks ending 11/3/2024 18
Organic versus conventional mushrooms sales Organic mushrooms increased volume sales with a shift to larger pack sizes 52 w.e. 11/3/2024 | Share of total mushroom sales and sales growth % Unit growth -3.3% Volume growth -4.2% Market size $1.2B $ Conventional growth -3.1% Unit growth +0.7% Volume growth +4.5% Market size $338M $ Organic growth +2.9% 20.1% of pound sales Source: Circana, Integrated Fresh, MULO+, 4 weeks ending 11/3/2024 compared with year ago 19
Cut/prepared versus whole mushrooms Whole and sliced had a very similar performance 52 w.e. 11/3/2024 | Share of total mushroom sales and sales growth % Unit growth -1.4% Volume growth -1.5% Market size $892M $ Whole growth -1.0% Unit growth -4.4% Volume growth -4.3% Market size $633M $ growth -3.1% Sliced Source: Circana, Integrated Fresh, MULO+, 4 weeks ending 11/3/2024 compared with year ago 20


 sales trend")


")


 versus random weight")