Financial Risk Evaluation: AMERIND Program Analysis

Overview
Review Overall Results
Liability Analysis & Recommendation
Property Analysis & Recommendation
AMERIND Core Values
•
Be here for as long as Tribes need us
•
Effective – are we serving all our Members
•
Affordable – how do we compare to our competitors
•
Sustainable – will we be here for another 35 years
•
Efficient – are we using Member money wisely
•
Everyone pays their fair share
•
Every cell stands on its own
Are we serving all our Members?
How do we compare to our Competitors?
How is IHBG really performing?
Are we sustainable?
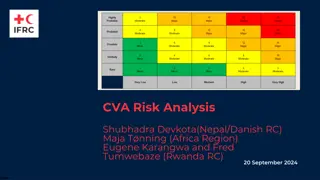
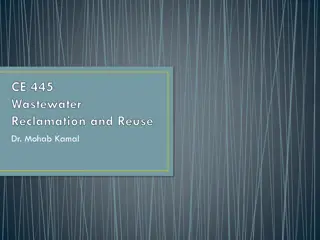
Probable Maximum Loss
Property
Industry Reinsurance Costs up ~ 58%
ISO Loss Costs increased 3.4 to 5.7%
Building inflation factor of 35-50%
Adjustment of Values to 150%
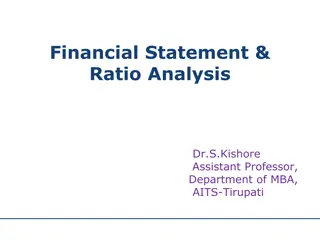
Property
Shrinking Dwelling Count
Amerind Risk Data
Property
Incurred Average per Claim
Amerind Risk Data
Property Claims
Total Claims Reported per Year
How much will it cost to fix homes?
Three-year average claims $14M
Prepare for 25-50% construction
inflation - $3.5 to $7M materials &
labor
•
Increase rates to pay for increased
claim costs
(estimated $3M)
•
Increase Property Values
replacement cost
(estimated $1.5M)
•
Do Not Limit Individual Member
increases
Other Options to lower costs
•
Limit minimum deductible to
$5,000 per Member per unit
(estimated savings $2M / 30% of Members file
claims)
•
Implement fire sub-deductible of
$10,000 per unit
(estimated savings $1.5M / 15% of Members
file fire claims)
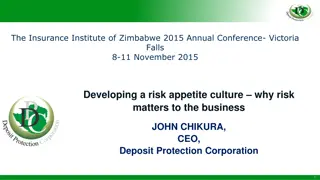
Liability
Ultimate Losses and Trends
Shock Losses
2016
LP Gas explosion
$1.325 M
2016
Gas explosion
$4.462 M
Gas explosion
$1.265 M
Amerind Risk Data
Average Losses $1.6M
Liability
2022 Trends
Reinsurance rates have doubled due to shock losses
Terms are unfavorable to AMERIND.
•
1
st
Layer – Quota Share 40% first $500k, $1M surprise increase
•
2
nd
Layer – Primary XOL $500k xs $500k, 500% inc or $1.5M
•
3
rd
Layer – Secondary XOL $5M xs $1M QS 20% of losses, 32% inc or $135k
•
Treaty reinsurance limits reduced in Alaska to $1M, XOL/XPL removed
Erosion of legal defenses (e.g. Lewis v. Clarke)
Liability Recommendation
Alaska limits in excess of $1M will require facultative reinsurance
at market rates
•
Forgo Casualty Treaty between $0-$5M
•
Increase IHBG Liability Retention up to $2M
Cyber Liability
2022 renewal terms - as expiring
•
$50,000 automatic limit for Risk Pool
•
No premium for coverage unless didn’t take training
•
Higher limits require submission
Premium ~ $450,000 - flat
Loss Activity - $843,000
•
7 Claims in NAHASDA
•
4 for full $50,000 limit
•
Average claim is $35,000
•
1 Claim in TGB for $500,000
Implemented Cyber Liability Loss Control for Members
Effective 1/1/2022
•
$5,000 retention
•
Members that don’t participate in prevention training will be charged for their Cyber
Liability premium
Do we have enough to cover our costs?
Three-year average:
•
Operating premium $15.3M to
pay claims and operations
(green area on chart)
•
Operating $3.9M
•
Reinsurance costs $6M
•
Hard market
•
58% increase cost 2023
•
$11M retention on Cat treaty
Options to lower op cost & reinsurance
•
Reduce Operations to 22% ratio
(estimated savings $0.9M)
•
Stop Loss change to 105%
operating ratio up to $3M
(estimated savings $0.3M)
•
Increase retentions to $5M
(estimated savings $1.3M)
Get reinsurance right?
Three-year average reinsurance
support
$3.1M recovery and $5.4M cost
•
Stop Loss Treaty set at 105%
operating ratio up to $3M
•
Catastrophic Treaty set at $58M
xs $3M
Options to offset increases
•
Stop Loss Treaty set at 105%
operating ratio up to $3M
•
Increase Catastrophic treaty
retention to $5M
•
Retain $2M Casualty
We built a strong company for a reason?
IHBG Balance Sheet Strength
$50.3M Total Net Assets
Exposures
•
Stop Loss Treaty set at 105%
operating ratio up to $3M
•
Increase Catastrophic treaty
retention to $5M
•
Retain $2M Casualty
AMERIND Rating Assessment 2021
Business Profile
BP
Neutral
(-1)
Balance Sheet
Strength
BSS
Very Strong
(a-)
Operating
Performance
OP
Strong
(+1)
Enterprise Risk
Management
ERM
Appropriate
(+0)
Country Risk
Published ICR
Rating
OVERALL
“a-”
•
Strongest level of BCAR
•
Top 10% in CAGR of surplus
over last 5 years
•
Conservative investment
strategy
– adjust?
•
Adequate reserves &
favorable historical
development
•
Comprehensive
reinsurance program
•
No debt
•
Positive outlook for
improvement with
continued BS/OP
performance
•
Sustainable competitive
advantage in providing
coverage for tribal risks
•
Tenured and well regarded
management team
•
Tribal marketplace
•
Regulated by stable and
consistent Cell Commission
•
Flexibility in pricing, terms
and conditions
•
Tax exempt- federal, state
premium tax
•
“Strong” performance
over last 5 & 10 year
periods with most recent
5 years significantly better
and reflective of on-going
strategy
•
Organic surplus growth
from operations
•
Return metrics align with
“Strong” peers
•
Key risks are identified
and monitored
•
Board approved formal
risk tolerances in place
•
Conservative risk
appetite
•
Strong governance and
controls
•
ERM evolving and
maturing
Need based on Performance and Policy
Recommendations
Recommendations
•
Construction inflation of 25-50%
•
Property Values to 150%
•
Overall increase of ~ 25%
•
Limit Individual Member change to performance
+30%/0% subject to changes in exposure, terms
or focus
•
Increases may be paid from Rate Stabilization
Fund
Sharing the Cost to Meet the Need
Recommendations
•
Increase base rate 10% to pay for increased claim costs
(estimated $2M increase)
•
Increase Property Values to 150% replacement cost
(estimated $2M increase)
•
Increase minimum deductible to $5,000 per unit x 500-800 claims
(estimated savings $2M)
•
Do Not Limit Individual Member increases
•
Decrease operations charge to 22%
(estimated savings $3M)
•
Change AM Re Stop Loss Treaty to 105% operating ratio up to $3M
(estimated savings on reinsurance $0.3M)
Through a comprehensive analysis of AMERIND program components like Core Values, Member Services, Competitor Comparison, Program Performance, and Sustainability, this report delves into key aspects such as risk exposure, potential liabilities, and operational efficiency. Findings highlight areas needing improvement for long-term sustainability and effectiveness.

Download Presentation

Please find below an Image/Link to download the presentation.
The content on the website is provided AS IS for your information and personal use only. It may not be sold, licensed, or shared on other websites without obtaining consent from the author.If you encounter any issues during the download, it is possible that the publisher has removed the file from their server.
You are allowed to download the files provided on this website for personal or commercial use, subject to the condition that they are used lawfully. All files are the property of their respective owners.
The content on the website is provided AS IS for your information and personal use only. It may not be sold, licensed, or shared on other websites without obtaining consent from the author.
E N D
Presentation Transcript
Overview Review Overall Results Liability Analysis & Recommendation Property Analysis & Recommendation
AMERIND Core Values Be here for as long as Tribes need us Effective are we serving all our Members Affordable how do we compare to our competitors Sustainable will we be here for another 35 years Efficient are we using Member money wisely Everyone pays their fair share Every cell stands on its own
Are we serving all our Members? We are losing performing members
How do we compare to our Competitors? AMERIND Competitors 100% Indian Owned Non-Indian 55% Indian Operated 5% Indian Operated A rated A- rated Deductibles $1000 to $25k Deductible $10k under & $25k over $100k Premium $345 per $100k value Premium $500-600 per $100k value Property Limits - $250M Property Limits $1B GL Limits $2M, Buy-up $10M GL Limits $2M, Buy-up $25M
Probable Maximum Loss Indicated CAT Risk Exposure Based upon Worldwide Exposures 2022 Gross Losses* (I) 2022 Pre-Tax Net Losses* (II) PER OCCURRENCE AGGREGATE** PER OCCURRENCE AGGREGATE** (06) (08) (01) (03) (05) (07) (02) (04) TVAR or TCE*** (Excluding Reinstatement Costs) ($000) TVAR or TCE*** (Excluding Reinstatement Costs) ($000) Loss Return Period (Annual Probability) Probable Maximum Loss (PML) ($000) Probable Maximum Loss (PML) ($000) PML (Including Reinstatement Costs ($000) PML (Excluding Reinstatement Costs ($000) TVAR or TCE*** ($000) TVAR or TCE*** ($000) 1. 20 Years (5.0%) 27,532 52,033 47,172 74,133 6,800 3,949 21,966 24,918 2. 50 Years (2.0%) 48,092 76,635 70,021 101,306 7,631 3,971 24,977 27,605 3. 100 Years (1.0%) 67,242 96,707 91,934 122,550 8,082 4,007 26,726 29,462 4. 200 Years (0.5%) 83,172 119,941 112,015 145,570 8,370 4,079 28,564 31,332 5. 250 Years (0.4%) 90,261 128,228 116,277 153,467 8,384 4,114 29,600 31,910 6. 500 Years (0.2%) 111,203 156,804 148,967 180,745 8,578 4,294 31,091 33,727 7. 1,000 Years (0.1%) 147,257 177,473 164,280 204,257 8,767 4,653 32,614 35,696
Property Industry Reinsurance Costs up ~ 58% ISO Loss Costs increased 3.4 to 5.7% Building inflation factor of 35-50% Adjustment of Values to 150%
Property Shrinking Dwelling Count Dwelling count continues to decline 50,000 43,539 45,000 42,881 42,784 42,325 41,496 41,134 40,000 36,747 36,115 35,000 32719 30,000 25,000 20,000 15,000 10,000 5,000 0 2013 2014 2015 2016 2017 2018 2019 2020 2021 Amerind Risk Data Dwellings Linear (Dwellings)
Property Incurred Average per Claim $70,000 $60,000 $50,000 $40,000 $30,000 $20,000 $10,000 $0 2015 2016 2017 2018 2019 2020 2021* Amerind Risk Data Trended Ultimate Cost per Claim Linear (Ultimate Cost Per Claim)
Property Claims Total Claims Reported per Year 800 750 700 600 500 400 308 299 293 285 300 265 234 200 100 0 2015 2016 2017 2018 2019 2020 *2021 2015 2016 2017 2018 2019 2020 *2021
How much will it cost to fix homes? Three-year average claims $14M Prepare for 25-50% construction inflation - $3.5 to $7M materials & labor Increase rates to pay for increased claim costs (estimated $3M) Increase Property Values replacement cost (estimated $1.5M) Do Not Limit Individual Member increases Other Options to lower costs Limit minimum deductible to $5,000 per Member per unit (estimated savings $2M / 30% of Members file claims) Implement fire sub-deductible of $10,000 per unit (estimated savings $1.5M / 15% of Members file fire claims)
Liability Ultimate Losses and Trends $7 Shock Losses Millions 2016 $6 LP Gas explosion $1.325 M $5 2016 Gas explosion $4.462 M $4 $3 Gas explosion $1.265 M $2 Average Losses $1.6M $1 $0 2014 2015 2016 2017 2018 2019 2020 2021 Amerind Risk Data
Liability 2022 Trends Reinsurance rates have doubled due to shock losses Terms are unfavorable to AMERIND. 1stLayer Quota Share 40% first $500k, $1M surprise increase 2ndLayer Primary XOL $500k xs $500k, 500% inc or $1.5M 3rdLayer Secondary XOL $5M xs $1M QS 20% of losses, 32% inc or $135k Treaty reinsurance limits reduced in Alaska to $1M, XOL/XPL removed Erosion of legal defenses (e.g. Lewis v. Clarke)
Liability Recommendation Alaska limits in excess of $1M will require facultative reinsurance at market rates Forgo Casualty Treaty between $0-$5M Increase IHBG Liability Retention up to $2M
Cyber Liability 2022 renewal terms - as expiring $50,000 automatic limit for Risk Pool No premium for coverage unless didn t take training Higher limits require submission Premium ~ $450,000 - flat Loss Activity - $843,000 7 Claims in NAHASDA 4 for full $50,000 limit Average claim is $35,000 1 Claim in TGB for $500,000 Implemented Cyber Liability Loss Control for Members Effective 1/1/2022 $5,000 retention Members that don t participate in prevention training will be charged for their Cyber Liability premium
Do we have enough to cover our costs? Three-year average: Operating premium $15.3M to pay claims and operations (green area on chart) Operating $3.9M Reinsurance costs $6M Hard market 58% increase cost 2023 $11M retention on Cat treaty Options to lower op cost & reinsurance Reduce Operations to 22% ratio (estimated savings $0.9M) Stop Loss change to 105% operating ratio up to $3M (estimated savings $0.3M) Increase retentions to $5M (estimated savings $1.3M)
Get reinsurance right? Three-year average reinsurance support $3.1M recovery and $5.4M cost Stop Loss Treaty set at 105% operating ratio up to $3M Catastrophic Treaty set at $58M xs $3M Options to offset increases Stop Loss Treaty set at 105% operating ratio up to $3M Increase Catastrophic treaty retention to $5M Retain $2M Casualty
We built a strong company for a reason? IHBG Balance Sheet Strength $50.3M Total Net Assets Exposures Stop Loss Treaty set at 105% operating ratio up to $3M Increase Catastrophic treaty retention to $5M Retain $2M Casualty Property $5M each Occurrence Liaibility $2M each Occurrence Excess Losses $3M Unrestricted Net Assets $39.7M (4 times)
AMERIND Rating Assessment 2021 Country Risk Enterprise Risk Management Balance Sheet Strength Published ICR Rating Operating Performance Business Profile BP ERM BSS OVERALL OP Strong (+1) Neutral (-1) Appropriate (+0) Very Strong (a-) a- Key risks are identified and monitored Board approved formal risk tolerances in place Conservative risk appetite Strong governance and controls ERM evolving and maturing Strongest level of BCAR Top 10% in CAGR of surplus over last 5 years Conservative investment strategy adjust? Adequate reserves & favorable historical development Comprehensive reinsurance program No debt Positive outlook for improvement with continued BS/OP performance Sustainable competitive advantage in providing coverage for tribal risks Tenured and well regarded management team Tribal marketplace Regulated by stable and consistent Cell Commission Flexibility in pricing, terms and conditions Tax exempt- federal, state premium tax Strong performance over last 5 & 10 year periods with most recent 5 years significantly better and reflective of on-going strategy Organic surplus growth from operations Return metrics align with Strong peers
Need based on Performance and Policy Recommendations COVERAGE IMPACT Recommendations Construction inflation of 25-50% $17,500,000 Property Property Values to 150% $1,500,000 Liability Overall increase of ~ 25% $300,000 THOL & Crime Limit Individual Member change to performance +30%/0% subject to changes in exposure, terms or focus $19,300,000 Estimated Net Losses Budgeted Operations $6,500,000 Increases may be paid from Rate Stabilization Fund Reinsurance $6,400,000 Overall Contribution $32,200,000
Sharing the Cost to Meet the Need Recommendations COVERAGE IMPACT Revised Minimum deductible $2,500 per unit $15,250,000 Property Increase base rate 10% to pay for increased claim costs (estimated $2M increase) $1,500,000 No change Liability Increase Property Values to 150% replacement cost (estimated $2M increase) THOL & Crime $300,000 No change Estimated Net Losses Increase minimum deductible to $5,000 per unit x 500-800 claims (estimated savings $2M) $17,050,000 Change to 22% operations ratio from 30% Budgeted Operations Do Not Limit Individual Member increases $3,500,000 Decrease operations charge to 22% (estimated savings $3M) Higher retention & 100% Combined ratio Reinsurance $4,700,000 Change AM Re Stop Loss Treaty to 105% operating ratio up to $3M (estimated savings on reinsurance $0.3M) Overall Contribution $25,250,000