Facts and Fallacies of Petroleum Vapor Intrusion Studies
The complexities of petroleum vapor intrusion (PVI) studies is crucial for assessing indoor air quality. This content delves into common myths and truths surrounding PVI, emphasizing the need for thorough sampling and analysis. Discussing critical factors like the dominance of TPH in vapor composition and the significance of diesel and jet fuel vapors, it sheds light on risk assessment and mitigation strategies in environmental health. With references from Hawaii Department of Health studies, the implications and misconceptions of PVI are explored in detail.

Download Presentation

Please find below an Image/Link to download the presentation.
The content on the website is provided AS IS for your information and personal use only. It may not be sold, licensed, or shared on other websites without obtaining consent from the author.If you encounter any issues during the download, it is possible that the publisher has removed the file from their server.
You are allowed to download the files provided on this website for personal or commercial use, subject to the condition that they are used lawfully. All files are the property of their respective owners.
The content on the website is provided AS IS for your information and personal use only. It may not be sold, licensed, or shared on other websites without obtaining consent from the author.
E N D
Presentation Transcript
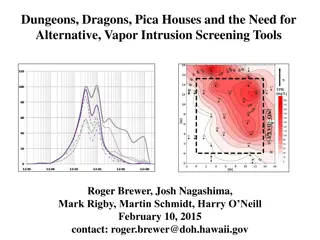
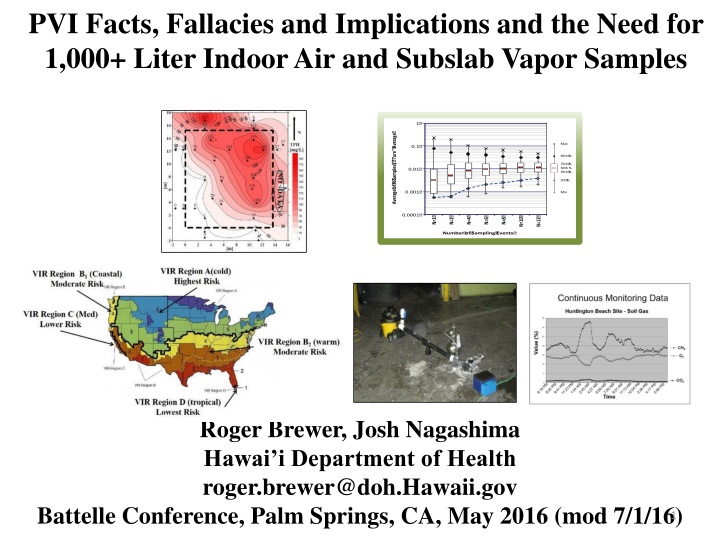
PVI Facts, Fallacies and Implications and the Need for 1,000+ Liter Indoor Air and Subslab Vapor Samples 1? Average? of? N? Samples? /? "Ture"? Average? Max 0.1? 95th? % 75th? % 50th % 25th? % 0.01? 5th? % 0.001? Min 0.0001? N=1? N=2? N=4? N=6? N=8? N=10? N=12? Number? of? Sampling? Events? Roger Brewer, Josh Nagashima Hawai i Department of Health roger.brewer@doh.Hawaii.gov Battelle Conference, Palm Springs, CA, May 2016 (mod 7/1/16) 1
Hawaii DOH References Petroleum Vapor Intrusion: Brewer, R., Nagashima, J., Kelly, M., Heskett, M. and M. Rigby. 2013. Risk-Based Evaluation of Total Petroleum Hydrocarbons in Vapor Intrusion Studies: International Journal of Environmental Research and Public Health, Volume 10, pp 2441-2467. Subslab Attenuation Factors: Brewer, R., Nagashima, J., Rigby, M., Schmidt, M. and O'Neill, H. (2014), Estimation of Generic Subslab Attenuation Factors for Vapor Intrusion Investigations. Groundwater Monitoring & Remediation, 34: 79 92. Guidance Documents: Technical Guidance Manual (field investigations) Environmental Hazard Evaluation (action/screening levels) HDOH Technical Guidance and Webinars: http://eha-web.doh.hawaii.gov/eha-cma/Org/HEER/
PVI Fallacies 1. Middle distillate fuels like diesel and jet fuel are not volatile; 2. Petroleum vapors are dominated by benzene and other aromatics; 3. Risk-based indoor air and soil gas action (screening) levels cannot be developed for TPH; 4. Benzene and/or other aromatics always drive PVI risk, including both gasoline and middle distillate fuels; 5. Vapor-phase aliphatics degrade much faster than aromatics (e.g., Biovapor model); 6. TPH (i.e., non-BTEX fraction) degrades below levels of PVI concern within three feet of the source; 7. Small volume, subslab soil vapor samples are best able to capture hot spots and assess worst-case vapor intrusion risk; 8. Exceeding a screening level implies a potential risk. 3
Fact #1: Diesel & Jet Fuels Generate Significant Vapors (see Brewer et al 2013) Weathered JP-4/JP-8 Vapors Weathered Diesel Vapors TPH = 5,923,000 g/m3 TPH = 37,830,000 g/m3 Hawaii subslab soil vapor screening level = 130, 000 g/m3 TPH dominated by C5-C8 to C9-C12 aliphatics (volatile component of fuel); Relative proportion of C9-C12 compounds in vapors varies widely; Request lab to report TPH as sum of C5-C12 (not TPHd ).
Fact #2: TPH Dominates Petroleum Vapors (and aromatics appear to be removed faster than aliphatics) TPH BTEXN (see Brewer et al 2013)
Fact #3: Risk-Based Methods for TPH Available Since 1990s (see Brewer et al 2013) Published TPH Toxicity Factors Massachusetts DEP (1990s) TPH Working Group (1990s) USDHHS (1999) Washington DOE (2006) California EPA (DTSC 2009) USEPA (2009) Reasonably similar except C5- C8 aliphatics; Several states publish risk- based screening levels for TPH; Massachusetts, California and Hawai i have TPH indoor air and soil gas screening levels for PVI (others?). 6
*USEPA Inhalation Toxicity Factors for Vapor-Phase Carbon Ranges *As used in Hawai i guidance Gasolines Middle Distillates Fuel Oils RfC = 100 g/m3 More Toxic Aromatics RfC = 600 g/m3 Aliphatics C9-16 C5-8 C9-18 C2 C4 C6 C8 C12 C16 C20 C24 C0 C28 C32 C36 Number of Carbon Atoms in Compounds TPH = Sum of Aliphatics + non-targeted Aromatics (e.g., BTEXN) 7
TPH Carbon Range Screening Levels (HDOH 2011 EALs, Appendix 1) 2Indoor Air Screening Level ( g/m3) 3Subslab Vapor Screening Level ( g/m3) 1Reference Concentration ( g/m3) Carbon Range C5-C8 Aliphatics C9-C18 Aliphatics C9-C16 Aromatics 600 630 630,000 100 104 104,000 100 104 104,000 1. After USEPA 2009 (see 2011 HDOH EAL guidance). 2. Based on USEPA RSL ambient air exposure model. 3. Residential vapor intrusion screening level, based on an assumed attenuation factor of 0.001 (Indoor Air:Subslab Soil Vapors). 8
Calculation of Total TPH Screening Levels (based on assumed carbon range makeup of vapors; HDOH 2011) Default Gasoline Vapor Composition *Default Diesel Vapor Composition *highly variable Weighted RfC= 571 ug/m3 Indoor Airres = 600 ug/m3 Soil Gasres = 600,000 ug/m3 *Weighted RfC= 126 ug/m3 Indoor Airres = 130 ug/m3 Soil Gasres = 130,000 ug/m3 Odor Recognition: Gasoline: 750+ ug/m3 Diesel: 3,500+ ug/m3 Assumed Subslab-Indoor Air AF = 0.001 9
Fact #4: *TPH Can Drive PVI Risk if Sufficiently Dominant Over Benzene (see Brewer et al 2013) 1TPH:Benzene Critical Ratio Vapor Intrusion Risk Driver TPH will always drive vapor intrusion risk (TPH HQ >1.0 even though benzene ECR <10-6) 2TPH could drive vapor intrusion hazards (depends on carbon range makeup) Benzene will always drive vapor intrusion risk. (assuming 10-6 screening level = 0.31 g/m3) >2,000:1 300:1 to 2,000:1 <300:1 1. *TPH could still pose a PVI risk even though benzene meets screening level; 2. Ratio of TPH:Benzene at which TPH will drive risk depends on TPH composition. Less TPH required if dominated by higher toxicity C9-C12 aliphatics; More TPH required if dominated by lower toxicity C5-C8 aliphatics. 10
TPH Drives PVI Risk Over BTEXN at Diesel and Low-Benzene Gasoline Sites Vapor Intrusion Risk Driver 1Benzene Drives Risk 170 206 301 1,513 4,174 18,710 9,135 18,611 2TPH Drives Risk HDOH Field Study Site/Fuel Type Gasoline (Fresh Vapors) Diesel (Fresh Vapors) JP-8 (Fresh Vapors) Site A (JP-4/AVGAS?) Site B (mixed fuels) Site C (JP-8 +/- JP-4) Site D (low-benzene gasolines) Site E (diesel) 1TPH: Benzene X X X X X X X X X 1. HDOH field study (see Brewer et al 2013). . 11
USEPA PVI Database (gasoline vapors targeted) Average TPH Vapor Makeup and Toxicity *Weighted RfC= 275 g/m3 Indoor Airres = 290 g/m3 Soil Gasres = 290,000 g/m3 Med TPH:Benzene = 300:1 Residential screening levels (assuming subslab AF = 0.001) *Average of 35 samples from 10 sites included in database; Critical TPH:Benzene Ratio=900:1; TPH could drive risk over benzene for 33% of database samples; Gasoline vapors more toxic that HDOH default (see HDOH 2011; Brewer et al 2013); Possible mix of diesel or kerosene vapors at some sites (high C9-C12 aliphatics)? 12
Fact #5: Higher Aliphatic Degradation Rate vs Aromatic Degradation Rate Not Supported by Field Data (predicted relative TPH depletion in vapors away from source not observed) TPHg in Soil Vapor Models (e.g., Biovapor) predict aromatics removed at faster rate than aliphatics; Opposite seen in field. TPH:BTEX = 13,000:1 TPH:BTEX = 5,500:1 Five Feet TPH:BTEX = 3,000:1 TPH:BTEX = 3,500:1 X-Section Gasoline UST Release AECOM 2012 13
Fact #6: Default 15ft PVI Separation Applies to TPH (USEPA & ITRC PVI guidance) Field Data: TPH vapors exceed screening levels 5- 10+ft above source; Models can underestimate TPH migration. TPHg in Soil Vapor TPH = 99,000,000 g/m3 TPH: 18,000,000 g/m3 Five Feet TPH = 140,000,000 g/m3 Weighted RfC= 308 g/m3 Indoor Airres = 320 g/m3 Soil Gasres = 320,000 g/m3 TPH:Benzene = 6,700:1! TPH drives PVI risk TPH = 310,000,000 g/m3 X-Section Gasoline UST Release AECOM 2012 14
Fact #7: Bigger Samples are More Representative Indoor Air: H. Dawson. 2015. Examples and Measures of Temporal Variability in Indoor Air Concentrations Arising from Vapor Intrusion: AWMA Annual Conference, Vapor Intrusion Panel, Raleigh, NC, June 24, 2015 (see also Dawson et al AEHS 2013) Subslab Soil Vapor: McAlary, T.A., Nicholson, P.J., Yik, L.K., Bertrand, D.M. and G. Thrupp. 2010. High Purge Volume Sampling A New Paradigm for Subslab Soil Gas Monitoring: Groundwater Monitoring & Remediation, 30: 73-85.
Mean Indoor Air Concentration Increases as the Sample Duration and Volume Increases (Dawson 2013, 2015) Classic signal of random, intra- and inter-day variability; Assumed to be caused by temporarily higher VOC concentrations in intruding vapors; Large volume and long duration samples required to capture variability, estimate daily mean and assess risk. SDM-Like House: VOC 100 10 Concentration (ug/m3) 1 0.1 0.01 0 50 100 150 200 250 300 Days 350 400 450 500 550 600 24-hr Samples 7-day Samples 100? 100? Average? of? N? Samples? /? "Ture"? Average? Avg.? of? N? 24-hr? Samples? /? "Ture"? Avg.? Max Max 10? 10? 95th? % 95th? % 75th? % 50th% 25th? % 75th? % 50th% 25th? % 1? 1? 5th? % 5th? % 0.1? 0.1? Min Min 0.01? 0.01? N=1? N=2? N=4? N=6? N=8? N=10? N=12? N=1? N=2? N=4? N=6? N=8? N=10? N=12? Number? of? Sampling? Events? Number? of? Sampling? Events? 16
Are Traditional Subslab Soil Vapor Samples Representative of Intruding Vapors and VI Risk? Targeted VI Exposure Duration Chronic (30 years) Chronic (6 years) Sub-Chronic (3 months) Acute (14 days) Acute (1 day) Acute (1 breath, 5 secs) *Equivalent Volume of Intruding Vapors 75 million liters 15 million liters 650 thousand liters 100 thousand liters 7,000 liters 2-4 liters *Assuming USEPA default vapor entry rate of 5L/minute for a 100m2 residential home.
Probably Not Discrete soil vapor samples are Too SMALL! Area Covered by Traditional Discrete Vapor Samples Vapor Plume Map Assumes collection from upper 15cm of fill under slab & 30% porosity; Small-volume sample data not reliably representative of subslab vapor plume; Less frequent, higher concentration areas of vapor plume likely to missed and mean VOC concentrations underestimated; Larger volume samples required to more reliably assess vapor intrusion risk.
HDOH Proposed Subslab Vapor Plume Characterization Study (pending, July 2016) Problem: Reliability of small number of small-volume, discrete vapor samples to characterize subslab vapor plumes unknown; Magnitude of random, small-scale variability around discrete sample points unknown; Testing of large numbers of subslab vapor samples not financially practical; Causes uncertainty of vapor intrusion investigations. Study Design: Overall: Use tight grid of passive subslab vapor samples to identify large-scale, subslab vapor plume patterns and target area for High Purge Volume sampling; Divide targeted slab area in grid cells for collection of passive soil vapor samples; Install four passive samplers in each cell and combine at lab for testing; Install triplicate sets of passive samples in three cells to test field precision of data; Install nine passive samplers in one cell to test small-scale variability; Collect HPV sample in identified hot area of vapor plume; Continuous monitoring of purge stream using a mobile gas chromatograph. Study Objectives: Evaluate number of passive samplers required to identify large-scale patterns; Assess data precision and reliability, ease and cost of implementation, etc.; Evaluate potential for artificial cold spots and hot spots in existing discrete sample data sets due to small-scale, random vapor concentration variability; Evaluate use of HPV samples to better represent targeted areas of subslab vapors.
The Search for More Representative Data HDOH Proposed Subslab Vapor Plume Characterization Study (former dry cleaner; pending, July 2016)
Former Dry Cleaner Honolulu, Hawaii Target Subslab Area (95 x 95 square, slab intact and in good condition)
Former Dry Cleaner 2002 Passive Soil Vapor Data PCE TCE Target Subslab Area
Former Dry Cleaner 2016 Active Soil Vapor Data Subslab Data PCE 1,710 g/m3 3-5 bgs Data PCE 53,300 g/m3 PCE 45,000 g/m3 PCE 188,000 g/m3 PCE 108,000 g/m3 PCE 9,560 g/m3 PCE 38,900 g/m3 PCE 108,000 g/m3 PCE 50,100 g/m3 PCE 6,750 g/m3 HDOH C/I Subslab Vapor Action Level PCE: 1,400 g/m3 Apparent high-concentration vapor plume under entire slab; Neither data set adequately representative; No clear pattern in VOC concentrations; Sample points too few points and/or sample volume too small.
Subdivide Slab Area into Grid Cells for Higher-Resolution Characterization PCE TCE Target Subslab Area
Subdivide Slab Area into Grid Cells for Higher-Resolution Characterization Subslab Data PCE 1,710 g/m3 3-5 bgs Data PCE 53,300 g/m3 PCE 45,000 g/m3 PCE 188,000 g/m3 PCE 108,000 g/m3 PCE 9,560 g/m3 PCE 38,900 g/m3 PCE 108,000 g/m3 PCE 50,100 g/m3 PCE 6,750 g/m3 HDOH C/I Subslab Vapor Action Level PCE: 1,400 g/m3
Carry out High-Resolution Passive Sampler Survey 25 Grid Cells Subslab Soil Vapor Samples Divide slab area into 25 grid cells; Install four passive samplers in each cell (address variability); Combine samplers for testing to generate a single value for each grid cell; Use results to identify large-scale vapor plume patterns under slab; Replicate sample sets collected in three cells to test field precision; Multiple single samples collected on one cell to test small-scale variability. Replicate Sample Cells Small-Scale Variability Cell
Test of Reproducibility of Grid Cell Data Replicate Sample Sets Replicate Sample Collection Collect replicate sample sets (triplicates) in grid cell located in highest anticipated VOC area; Install three passive samplers in each of four subcells (e.g., sets A, B, and C; approx. 5ft spacing); Combine samplers for each replicate set for individual analyses (total three analyses per grid cell); Calculate RSD to assess precision of data. A A Replicate Sample Design B C A B C B C A B C
Test of Small-Scale Variability Within Grids Multiple Single Samples Small-Scale Variability Install and individually test nine evenly spaced, passive samplers in one grid cell; Evaluate variability in data to assess representativeness of data for single sample points. Small-Scale Variability Sample Design
Identify Large-Scale Concentration Patterns (hypothetical results indicated) Hot Area Identified Subslab Soil Vapor Samples Assign passive sample data results to appropriate grid cell; Identify apparent, large-scale patterns in subslab vapor concentrations (hypothetical hot area shown); Use to target HPV sample collection. Beacon Passive samplers: http://www.beacon-usa.com/services/passive-soil-gas-surveys/
Collect High Purge Volume Vapor Sample (e.g., from highest concentration area) High Purge Volume Sample (example) Single, HPV subslab vapor sample collected from identified vapor high- concentration under slab; 30ft radius Vapor plume DU area targeted (estimated 25,000 liters air- filled pore space in upper 12 assuming 30% porosity); Area of influence uncertain - controlled variability in vapor permeability, preferential pathways, etc.; Objective: Mimic hypothetical vapor entry HPV point over 24 hours; Single, 7,000 liter (?) HPV subslab vapor purge; Triplicate 6L summa samples collected during purge to test data precision. HPV Sample Collected ? ? ? ? Beacon Passive samplers: http://www.beacon-usa.com/services/passive-soil-gas-surveys/
How to Collect a Really BIG and Really REPRESENTATIVE Subslab Vapor Sample (McAlary et al 2010) Collect triplicate, 6L summas to test HPV data precision and reproducibility Able to purge 100s to 1,000s liters of subslab vapor (1-3,000 liters/min); Samples collected from purge/slip stream using 6L Summas; Target purge and summa collection time 30 minutes? Equates to purge rate in the low 100s L/minute for a 5,000L draw; Pretest, monitor and limit purge/sampling vacuum to < 7 Hg ; Avoid downward leakage of outdoor air into slab and dilution of vapor stream. 31
Continuous Monitoring of Purge Stream Portable gas chromatograph to be used for continuous monitoring of purge stream and/or collection of multiple samples during purging; Data used to further evaluate small-scale heterogeneity of VOC concentrations in subslab vapor plumes. 32
Total Sample Collection and Analysis 1. Passive Samplers: Passive Samplers Per Cell Total Samplers Deployed Grid Cell Type # of Cells Analyses Per Cell Total Analyses Sample Type 4 pt Standard: 21 4 84 1 21 composite 4 pt composite single sampler Replicates: 3 12 36 3 9 Variability: 1 9 9 9 9 Total: 25 Total: 129 Total: 39 2. Active HPV Summa Samples: Three 6L Summas; Three TO-15 analyses; 3. Mobile GC monitoring of HPV slip stream.
Summary of PVI Facts and Path Forward 1. Middle distillate fuels like diesel and jet fuel are volatile; 2. Petroleum vapors are dominated by TPH aliphatics; 3. Risk-based indoor air and soil gas action (screening) levels can be developed for TPH; 4. Benzene likely to drive PVI risk at high-benzene (e.g., pre-2005) gasoline release sites, but TPH likely to drive PVI risk at low- benzene gasoline sites and all middle distillate sites; 5. TPH does not degrade faster than BTEX (possibly reverse); 6. A minimum 15ft PVI separation distance is appropriate for TPH; 7. Large-volume indoor and air soil vapor samples required to capture and represent small-scale vapor plume heterogeneity: Designation of Decision Unit area and volume of soil vapor plume for sample collection is important (sampling theory); Use High Purge Volume sampling method to collect representative vapor sample from targeted DU and assess PVI risk; Attempts to use small-volume (e.g., 50ml) samples to identify acute hot spots unreliable and misleading. 34
Questions? Think BIGGER!


")