Factors Affecting Coral Reef Distribution
Understanding the distribution of coral reefs involves considering factors such as latitude, depth, and ocean surface temperature. This data-driven classroom study explores how these factors impact the presence and health of coral reefs worldwide, from their locations to the effects of heat stress and bleaching events.

Download Presentation

Please find below an Image/Link to download the presentation.
The content on the website is provided AS IS for your information and personal use only. It may not be sold, licensed, or shared on other websites without obtaining consent from the author. If you encounter any issues during the download, it is possible that the publisher has removed the file from their server.
You are allowed to download the files provided on this website for personal or commercial use, subject to the condition that they are used lawfully. All files are the property of their respective owners.
The content on the website is provided AS IS for your information and personal use only. It may not be sold, licensed, or shared on other websites without obtaining consent from the author.
E N D
Presentation Transcript
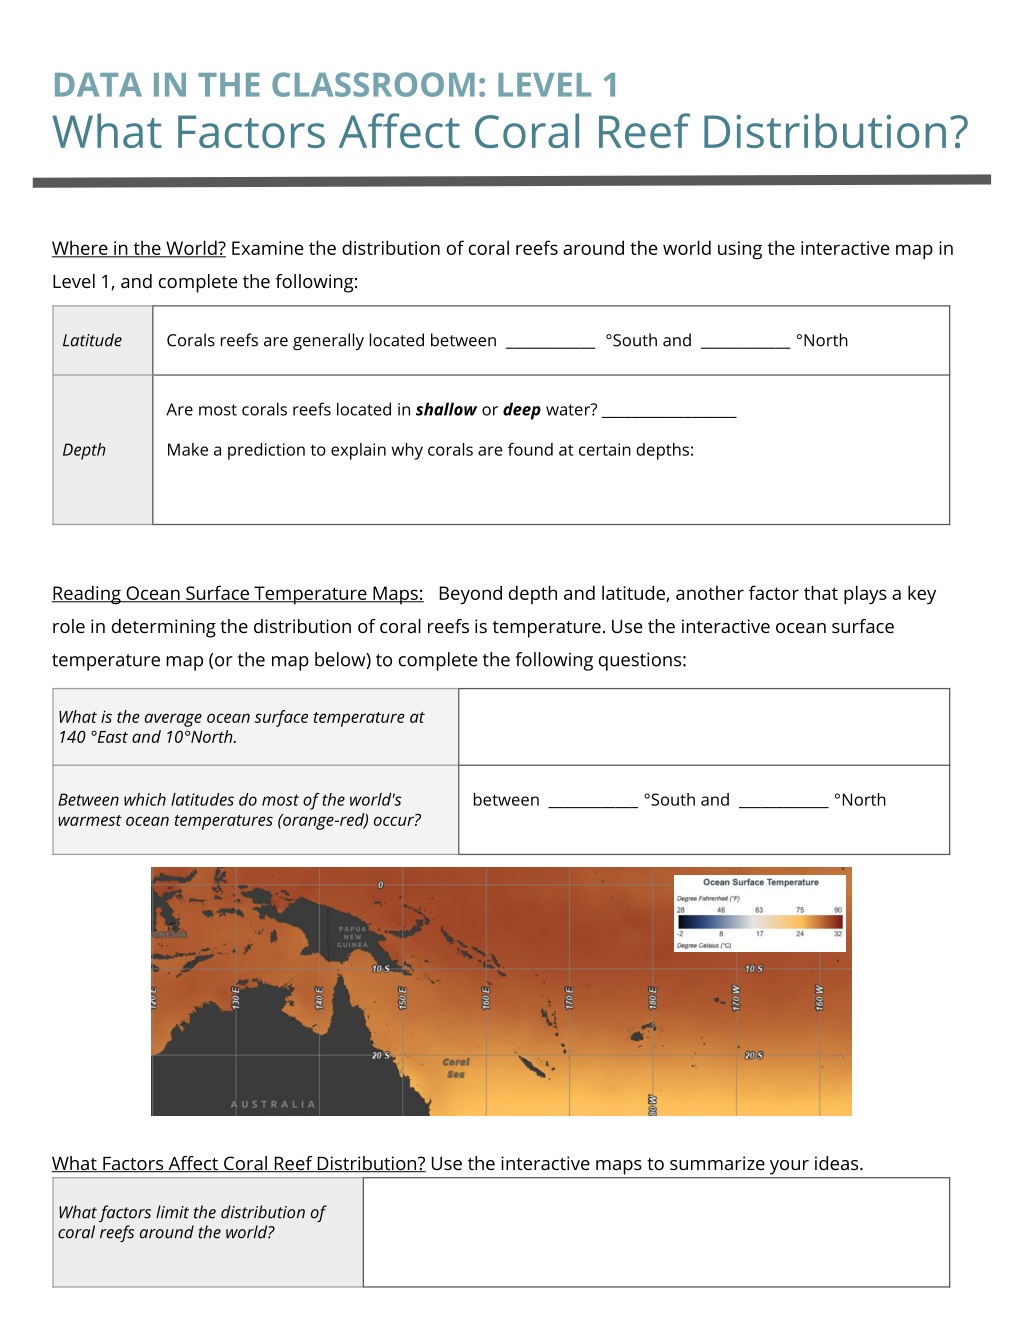
DATA IN THE CLASSROOM: LEVEL 1 What Factors Affect Coral Reef Distribution? Where in the World? Examine the distribution of coral reefs around the world using the interactive map in Level 1, and complete the following: Latitude Corals reefs are generally located between ____________ South and ____________ North Are most corals reefs located in shallow or deep water? __________________ Depth Make a prediction to explain why corals are found at certain depths: Reading Ocean Surface Temperature Maps: Beyond depth and latitude, another factor that plays a key role in determining the distribution of coral reefs is temperature. Use the interactive ocean surface temperature map (or the map below) to complete the following questions: What is the average ocean surface temperature at 140 East and 10 North. Between which latitudes do most of the world's warmest ocean temperatures (orange-red) occur? between ____________ South and ____________ North What Factors Affect Coral Reef Distribution? Use the interactive maps to summarize your ideas. What factors limit the distribution of coral reefs around the world?
DATA IN THE CLASSROOM: LEVEL 2 Measuring Coral Heat Stress Measuring Heat Stress: In 2024, satellite data recorded one of the most severe global oceanic heat waves in modern history. Here, we'll examine data to find out how this heat wave impacted corals on the the Great Barrier Reef, the largest coral reef system in the world. Answer the questions using the graph. During what months are ocean temperatures highest in Australia? How would you define the term bleaching threshold ? Use the data to describe the 2024 heat wave on the Great Barrier Reef in terms of its duration. In other words, how long did the heat wave last? Calculating Accumulated Heat Stress: Prolonged and severe heat stress makes coral bleaching more likely and recovery more difficult. Use the graph to answer the questions below. Calculate the total value of accumulated heat stress on the Great Barrier Reef during the first 12 weeks of 2024. Explain why calculations of accumulated heat stress are useful and important. Understanding Maps of Accumulated Heat Stress: Do you agree or disagree with the claim below? Support your answer with specific evidence from the map. Claim During the time period indicated on the map, most corals around the starred area were at a very low risk of bleaching.
DATA IN THE CLASSROOM: LEVEL 3 Monitoring Coral Reefs Identifying Differences Between Healthy, Bleached & Dead Corals: Summarize your observations below. Healthy: What are the key differences between healthy, bleached and dead corals? Bleached: Dead: Observing the Effect of Bleaching on Coral Reefs: Visit each of the four coral reefs. Examine the photos and complete the table below. Note: Reef #1 is partly completed for you. Coral Reef Name and Location Time period Observations: Do corals appear mostly healthy, bleached or dead? What else do you notice? Reef #1: 2004 (image at left) Example: Most coral appears healthy. Phoenix islands, Republic of Kiribati Coral is bright green and yellow. Lots of colorful fish are present. 2016 (image at right) 2015 (image at left) Reef #2: Pago Pago, American Samoa 2016 (image at right) March (image at left) Reef #3: Lizard Island, Great Barrier Reef, Australia May 2016 (image at right) August 2015 (image at left) Reef #4: Kahului Point, Maui, Hawaii Nov 2015 (image at right) Summarize your observations: What are 2-3 of the most visible signs that a coral reef has undergone a bleaching event?
LEVEL 3: continued from previous page Monitoring Coral Health Using Quadrat Sampling: 1. Make sure you understand assess corals in the quadrat by reviewing this example for Reef #1. Square # Is Coral Dead? 0 = coral is alive 1 = coral is dead Is Coral Bleached? 0 = unbleached 10 = completely bleached Leave blank since coral inside this square #4 is dead 4 1 16 0 3 2. Record your observations inside each yellow square on the image for reef # _________. Square # Is Coral Dead? 0 = coral is alive 1 = coral is dead Is Coral Bleached? 0 = unbleached 10 = completely bleached Sum the values above to calculate the total squares dead Average the values above to estimate the proportion bleached. Calculate percent bleached by multiplying the above average by 10. Calculate percent dead by multiplying the above total by 10. 3. Analyze your data below. Assess the health of of the area you monitored using evidence from the data table above.
DATA IN THE CLASSROOM: LEVEL 4 Identifying a Bleaching Event 1. Analyzing Data From the Florida Keys: To what extent is heat stress affecting the health of Florida s coral reefs? Collect & analyze evidence from interactive map & links provided within Level 4. Record your observations in the table below. Graph: Were the corals in the Florida Keys at high risk, moderate risk or low risk of bleaching due to heat stress during the last 4 years? Describe data and trends shown on the graph. Observations from Condition Report: Where did bleaching occur in the Florida Keys during the past year(s). How severe was it? Describe specific data & observations from the report. 1. Construct an Explanation: Is heat stress affecting the health of Florida s coral reefs? Use the claim, evidence, reasoning format to construction an explanation below. Claim: To what extent is heat stress affecting the health of Florida s coral reefs? Evidence: Include specific data from your table above to support your claim. Reasoning: Connect what you observed (evidence) and what you believe (claim). This part also often includes scientific principles or concepts.
DATA IN THE CLASSROOM: LEVEL 5 Design an Investigation 1. Develop Your Question: Ask a question that can be answered using the available data. Some sample questions are below. How has sea surface temperature affected the health of coral reefs near the Galapagos, Hawaii, Fiji, or the Great Barrier Reef in the past 12 months? How has changing sea surface temperature affected the frequency and intensity of coral bleaching at the Great Barrier Reef since 2000? Which coral reef is most at risk of bleaching due to rising sea surface temperatures: Florida Keys, Galapagos, Hawaii, or the Great Barrier Reef? Identify a question of interest. 2. Collect Data: Collect the data that you need to answer your question using the data tools from Level 5. If possible, paste or attach any relevant graphs or data tables to this document. 2. Construct an Explanation: Use the claim, evidence, reasoning format to construction an explanation below. Claim: Record a simple statement that answers your question and is based upon evidence. Evidence: Include specific data from the the data maps or graphs you have analyzed. Reasoning: Connect the evidence to your claim.


