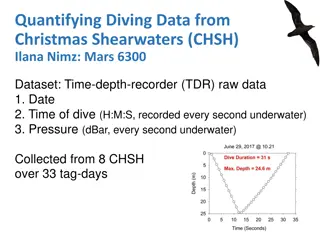
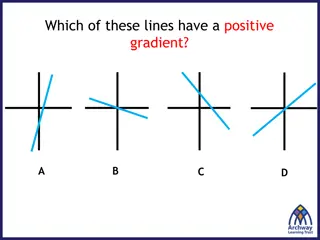
Exploration of Frequency Interactions and Correlations in High Scatter Events
Delve into the analysis of high scatter events through spectrograms and waveform comparisons of varying frequencies. Researchers investigate correlations with different signals and accelerometers, seeking to replicate and identify key patterns in the observed noise data. Ongoing efforts include examining motion thresholds, lock losses coinciding with specific events, and historical data analysis for configuration changes impact assessment.

Download Presentation

Please find below an Image/Link to download the presentation.
The content on the website is provided AS IS for your information and personal use only. It may not be sold, licensed, or shared on other websites without obtaining consent from the author.If you encounter any issues during the download, it is possible that the publisher has removed the file from their server.
You are allowed to download the files provided on this website for personal or commercial use, subject to the condition that they are used lawfully. All files are the property of their respective owners.
The content on the website is provided AS IS for your information and personal use only. It may not be sold, licensed, or shared on other websites without obtaining consent from the author.
E N D
Presentation Transcript
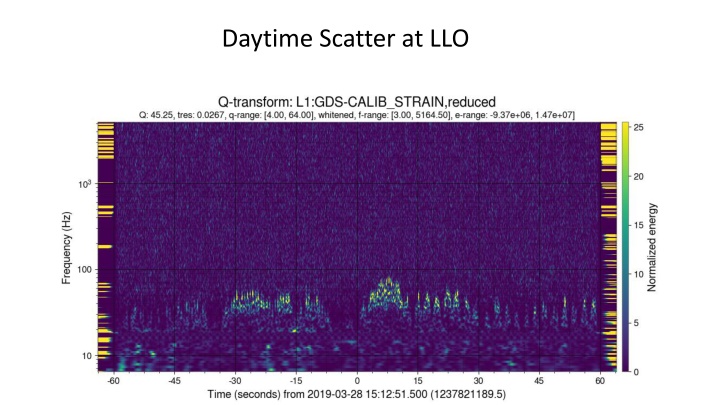
Spectrogram during high scatter time ???????? = 2?????(?) ? Scatter model using ~0.2 Hz + ~4 Hz velocities
1 cycle in 5 sec = 0.2 Hz 0.2 Hz Sine wave Abs(0.2 Hz Sine wave) Abs(0.2 Hz Sine wave + 4.45 Hz Sine wave)
But its not as simple when you beat two frequencies against each otherHere we see that the amplitude of the 4.45 Hz is smaller than the 0.2 Hz, so the small peaks correspond to a full cycle instead of a half cycle as we saw with the 0.2 Hz series. ?t = 0.22 sec -> 4.45 Hz
Whats been done: Next steps: Marissa, Sidd, et al looked for correlations with trains during noise sprint in January, but didn t find a clear winner Terra looked for ~4 Hz motion in accelerometers during scatter times, but didn t find a clear winner (alog 44897) Lots of injections at various places show high coupling at End-Y, but haven t been able to fully replicate the noise we see or identify a sensor that sees the same motion as the scattering surface (alogs 41789,44485 + many more) Collect statistics on fast and slow arches as Josh did in alog 44803 Look for correlations with motion of mirrors as Andy did in alog 44561 Look for correlations with control signals: ASC, tidal, etc (can provide a list of channels) Look back through commissioning data to see if the behavior changed with IFO configuration changes Continue to look for correlations with accelerometers (as per Terra s work in 44897)
Other ideas Look for thresholds of motion Is there a threshold of the sum of the microseism BLRMS and anthropogenic BLRMs for scatter in DARM? Look at locklosses coincident with trains April 6 at ~14:00 UTC Range dip April 8 at ~0:00 UTC