Experimental Evidence on Improving Learning Outcomes
Lack of accountability can lead to poor learning outcomes in schools. This study explores the impact of providing information on students' performance through experimental interventions in Indian villages. The paper discusses the effectiveness of school accountability programs, evidence from developing countries, and the channels through which information provision can enhance student outcomes.
Download Presentation

Please find below an Image/Link to download the presentation.
The content on the website is provided AS IS for your information and personal use only. It may not be sold, licensed, or shared on other websites without obtaining consent from the author.If you encounter any issues during the download, it is possible that the publisher has removed the file from their server.
You are allowed to download the files provided on this website for personal or commercial use, subject to the condition that they are used lawfully. All files are the property of their respective owners.
The content on the website is provided AS IS for your information and personal use only. It may not be sold, licensed, or shared on other websites without obtaining consent from the author.
E N D
Presentation Transcript
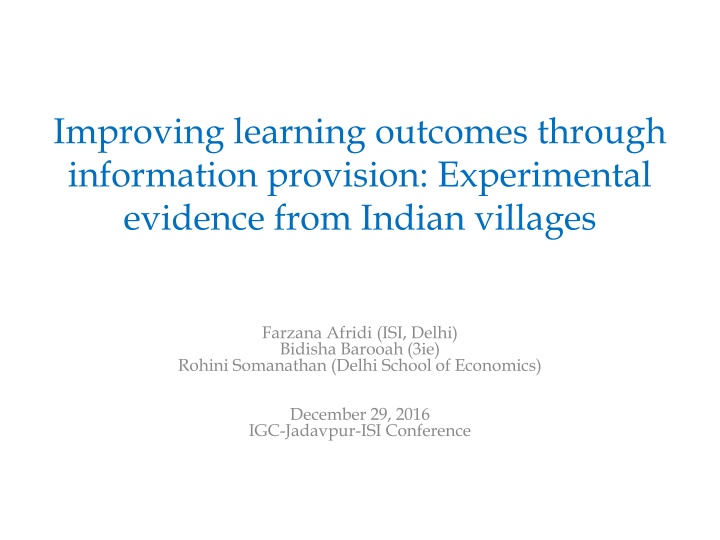
Improving learning outcomes through information provision: Experimental evidence from Indian villages Farzana Afridi (ISI, Delhi) Bidisha Barooah (3ie) Rohini Somanathan (Delhi School of Economics) December 29, 2016 IGC-Jadavpur-ISI Conference
Motivation Lack of accountability is often cited as a reason for the poor quality of public service provision. Insufficient accountability and low stakeholder awareness can co-exist in the provision of education, leading to poor learning outcomes in schools.
Motivation High Enrolment Over 92% of children aged 6-12 are enrolled in school Almost all villages have a public primary school First generation learners 30% illiteracy among adults Poor learning levels 50% of grade 5 students in public schools cannot read a grade 2 text (ASER) Steady increase in private schooling 30% of students aged 6-14 enrolled in rural private schools (ASER) Grew by over 11 ppt in 8 years between 2006-2014 Better learning outcomes but high variation in quality
Literature Evidence on the effectiveness of school accountability programs on students learning outcomes is mixed (Figlio and Loeb, 2011) - positive effects of these initiatives on students learning outcomes (Ladd 1999; Jacob 2005; Wong et al. 2009) - accountability programs could lead school managements to behave strategically in order to cross the learning thresholds (Koretz and Barron 1998; Jacob and Levitt 2003; Figlio and Getzler 2006)
Literature Information on schools performance on standardized tests to local stakeholders can improve learning outcomes by improving accountability through choice, participation and voice (World Bank, 2011). - Experimental evidence on such initiatives from developing countries has, however, been inconclusive (Andrabi et al. 2014; Banerjee et al. 2008) - The channels through which information provision can improve student outcomes remain unclear.
This paper Random assignment of households and schools to either a control group in which no attempt was made to bridge existing information gaps in the education market or one of four treatments. In each treatment either households or schools or both were provided a report card on the performance of students in curriculum based tests designed and administered by us. Treatments provided either absolute or absolute and relative learning performance to stake holders. Identify the channels through which outcomes are affected.
Preview of findings We find significant improvement in test scores of private schools students in response to provision of information on relative learning levels to both households and schools. There is no improvement in the learning outcomes of public school students in any treatment. Evidence of change in household inputs lower school absence and school choice - as a result of information provision.
Our context Ajmer district of northern state of Rajasthan Poor adult literacy (59%, lower than state average) High urbanisation High primary school enrolment High prevalence of private schools
Study Design Randomized experiment 159 schools from 72 villages assigned to one control and 4 treatment groups. Both public and private primary schools included. Standardized tests administered to all students in grades 4 and 5. Household survey of 1499 randomly selected students.
Timeline Date Activity Data Village survey School survey Household survey Student test scores Jul, Aug, Sept, 2011 Oct, Nov 2011 Baseline Report card intervention Feb, Mar 2012 Midline Student test scores School survey Household survey Student test scores Aug, Sep, Oct 2012 Endline
Report card intervention Control T1 T2 T3 T4 Report card recipient Type of report card None P1 P1 P1 P1 and P2 Household S1 and S2 S1 and S2 School None None S1 Number of schools Public 35 29 37 28 30 18 16 26 16 20 Private 17 13 11 12 10 Number of students Public 1064 860 1319 918 996 523 499 858 486 599 Private 541 361 461 432 397
Report card intervention P1: Parental Report Card (Absolute Info) Student's score in three subjects out of 100 Student's rank in class P2: Parental Report Card (Relative Info) Student's rank in panchayat S1: School Report Card (Absolute Info) Average scores of each grade Average learning levels of students in school S2: School Report Card (Relative Info) Relative rank of school in panchayat
Data Child characteristics balance at baseline Treatment - Control T3 (4) (N=1319) -5.23 (4.430) -2.38 (2.089) -0.68 (1.096) -2.10 (1.484) -0.16 (0.102) 0.06* (0.034) -0.01 (0.032) Control (1) (N=1064) 64.72 (2.422) 27.77 (1.070) 18.71 (0.720) 17.84 (0.901) 0.51 (0.059) 0.54 (0.024) 0.53 (0.018) T1 (2) (N=859) -8.66* (4.527) -3.73* (1.871) -1.96 (1.269) -2.87* (1.557) -0.09 (0.085) 0.10*** (0.036) -0.03 (0.026) T2 (3) T4 (5) (N=995) -2.64 (2.802) -1.78 (1.266) -0.25 (0.812) 0.73 (0.100) -0.11 (0.079) 0.00 (0.035) -0.01 (0.036) (N=918) -5.58 (5.910) -3.06 (2.645) -0.99 (1.552) -1.59 (1.798) -0.04 (0.132) 0.05 (0.041) -0.02 (0.023) Individual characteristics Overall raw test score Hindi test score Math test score English test score+ Enrolled in private school Male child Child enrolled in grade 4 Household characteristics Age of child (N=327) 10.71 (0.108) 0.50 (0.010) 1.94 (0.168) (N=273) -0.11 (0.170) 0.01 (0.015) -0.15 (0.209) (N=346) -0.11 (0.124) 0.02 (0.014) -0.07 (0.225) (N=263) -0.42** (0.150) -0.01 (0.013) -0.05 (0.240) (N=291) -0.24 (0.162) 0.01 (0.013) 0.08 (0.246) Child enrolled in grade 4 Household head s education Household head daily wage worker 0.47 -0.04 0.00 0.05 0.01 (0.044) 4.89 (0.145) (0.065) 0.14 (0.218) (0.054) -0.06 (0.162) (0.069) -0.07 (0.213) (0.064) -0.24 (0.267) Household s wealth index Household s education expenditure 1874.02 -0.365.55 -458.90 -482.76 -294.48 (224.113) (247.665) (268.303) (295.825) (469.348) Standard errors clustered at panchayat-level in parenthesis. Significance *** 1% **5% *10%.
Data School characteristics balance at baseline Treatment - Control T2 (3) (N=37) -0.19** (0.090) -4228.60 (6850.155) (6996.064) -271.50 (194.637) (249.061) -0.08 (0.072) -0.05 (0.092) -19.25 (22.532) (20.679) 2.02 (3.045) -0.14 (0.096) -0.41** -0.50*** (0.160) Control (1) (N=35) 0.49 (0.068) 19261.09 (6741.121) 755.09 (158.356) 0.83 (0.033) 0.25 (0.066) 204.63 (14.495) 28.24 (1.055) 0.89 (0.037) 3.69 (0.094) T1 (2) T3 (4) T4 (5 ) (N=29) -0.04 (0.095) -4549.67 (N=28) -0.06 (0.137) -5510.87 (7152.688) -249.74 (202.536) -0.02 (0.051) -0.08 (0.085) -9.13 (34.441) 3.18 (2.200) -0.14 (0.097) -0.47** (0.220) (N=30) -0.15 (0.103) -4219.19 (6928.337) -19.88 (280.305) -0.07 (0.062) 0.01 (0.086) 1.44 (30.219) 3.07 (2.380) -0.10 (0.072) -0.45*** (0.142) Private school Monthly teacher salary (Rs.) Annual tuition (Rs.) -184.64 Proportion of graduate teachers -0.12** (0.053) -0.01 (0.082) -2.14 Proportion of local teachers Total enrolment in school Pupil-teacher ratio 6.47*** (1.658) -0.07 (0.068) Presence of SMC Proportion of facilities in school (0.135) Standard errors clustered at panchayat-level in parenthesis. Significance *** 1% **5% *10%.
Data Private and public schools comparable in resources but not accountability at baseline SCHOOL RESOURCES SCHOOL ACCOUNTABILITY SMC exists Local teachers Prop. Graduate teachers Pupil teacher ratio Prop. Teacher salary (Rs.) School Enrolment Infrastructure index Public [N=96] Private [N=63] Difference 188.04 (13.370) 216.41 (13.008) -28.371 (19.587) 3.25 (0.074) 3.44 (0.108) -0.194 (0.126) 0.770 (0.029) 0.768 (0.030) 0.001 (0.044) 32.63 (1.280) 29.14 (1.423) 3.487* (1.957) 0.95 (0.024) 0.58 (0.063) 0.366*** (0.059) 0.151 (0.033) 0.350 (0.040) -0.199*** (0.052) 23792.8 (2476.687) 2825.658 (197.792) 20967.12*** (3137.245) Public school students households more constrained and less informed at baseline Education of household head Daily wage worker Education expenditure (Rs.) Desired years of schooling Know of existence or non- existence of SMC Wealth index Public [N=897] Private [N=602] Difference 1.64 (0.047) 2.30 (0.054) -0.661*** (0.072) 0.55 (0.017) 0.38 (0.020) 0.169*** (0.026) 4.56 (0.046) 5.26 (0.056) -0.698*** (0.072) 520.76 (16.514) 3108.43 (77.069) -2587.66*** (66.267) 8.57 (0.091) 9.25 (0.082) -0.677*** (0.130) 0.34 (0.016) 0.44 (0.020) -0.096*** (0.025) Standard errors clustered at panchayat-level in parenthesis. Significance *** 1% **5% *10%.
Data Divergence between parental expectation and student performance at baseline Public Schools Student performance (2) Private Schools Student performance Scholastic skill Parental Expectation (1) Parental Expectation (3) Differe- nce (3)-(4) Difference (1)-(2) (4) Hindi Alphabet recognition 0.98 0.71 0.267*** 0.99 0.91 0.087*** (0.019) 0.117*** (0.017) 0.149*** (0.022) -0.176*** (0.026) (0.014) 0.027*** (0.010) 0.018 (0.018) -0.091*** (0.023) Word construction 0.93 0.81 0.99 0.96 Sentence construction 0.64 0.49 0.89 0.87 Comprehension 0.50 0.68 0.80 0.89 Math Count 0.98 0.87 0.115*** (0.014) -0.016 (0.018) 0.323*** (0.025) 0.99 0.97 0.029*** (0.009) 0.004 (0.011) 0.269*** (0.026) 2-digit operation without carry over 0.85 0.87 0.98 0.97 3-digit operation without carry over 0.58 0.26 0.87 0.60 English Alphabet recognition 0.93 0.67 0.264*** (0.020) -0.236*** (0.024) 0.99 0.91 0.082*** (0.014) -0.153*** (0.021) Word construction 0.51 0.74 0.80 0.95 Standard errors clustered at panchayat-level in parenthesis. Significance *** 1% **5% *10%.
Empirical methodology Impact on test scores Yit = 0 + k Tk + Yi0 + it Yit: normalized score of student i in post-intervention round t, t=1,2 T k: dummy for treatment k=1,2,3,4 Yi0 : normalised baseline score of student i i: error term
Results Treatment improved learning outcomes of private school students Treatment type Endline - Baseline Difference Treatment Control (1) (2) (1) (2) Public Schools T 1 0.039 0.074 -0.036 (0.087) -0.085 (0.073) -0.133 (0.087) -0.033 (0.085) T 2 -0.010 0.074 T 3 -0.059 0.074 T 4 0.041 0.074 Private Schools T 1 -0.207 -0.329 0.122* (0.065) 0.139** (0.062) -0.019 (0.063) 0.101* (0.056) T 2 -0.190 -0.329 T 3 -0.348 -0.329 T 4 -0.229 -0.329
Results Overall test scores at end line improved for private school students in T4 Private (1) T 1 0.129 (0.133) T 2 0.111 (0.147) T 3 -0.020 (0.100) T 4 0.308*** (0.108) Baseline score 0.584*** (0.046) Constant -0.809** (0.335) Joint Significance 6.148 [0.001] T1=T2 0.038 [0.848] T2=T3 1.585 [0.218] T3=T4 23.69 [0.000] All controls Yes N 1338 R2 0.368 Public (2) -0.100 (0.162) 0.009 (0.167) -0.038 (0.139) -0.047 (0.104) 0.598*** (0.048) -0.157 (0.566) 0.197 [0.938] 0.522 [0.476] 0.069 [0.795] 0.004 [0.953] Yes 1658 0.280 Standard errors clustered at panchayat-level in parenthesis. Significance *** 1% **5% *10%.
Results Strongest improvements in private school students language scores at end line Private Public Hindi English Math Hindi English Math T 1 -0.001 (0.112) -0.009 (0.128) -0.047 (0.087) 0.315*** (0.089) 0.0840 (0.111) 0.169 (0.107) -0.037 (0.083) 0.260** (0.096) 0.445*** (0.045) -0.896*** (0.312) Yes 1338 0.246 0.303 (0.188) 0.191 (0.189) 0.008 (0.141) 0.281* (0.150) 0.415*** (0.032) -1.033** (0.440) Yes 1338 0.237 -0.234 (0.156) -0.031 (0.131) -0.120 (0.106) -0.057 (0.080) 0.499*** (0.047) 0.243 (0.469) Yes 1658 0.258 0.017 (0.171) -0.029 (0.172) -0.003 (0.132) -0.090 (0.135) 0.486*** (0.045) -0.541 (0.523) Yes 1658 0.202 -0.091 (0.166) 0.062 (0.149) -0.009 (0.190) 0.074 (0.133) 0.309*** (0.051) -0.093 (0.608) Yes 1658 0.113 T 2 T 3 T 4 Baseline score 0.556*** (0.037) -0.377 (0.297) Yes 1338 0.309 Constant All controls N R2 Standard errors clustered at panchayat-level in parenthesis. Significance *** 1% **5% *10%.
Results - Mechanisms But public school students responded by improving school presence at endline Private (1) -0.0690 (0.0676) Public (2) 0.0854** (0.0401) Treatment Baseline score 0.116*** (0.0330) 0.598*** (0.200) Yes 367 0.141 0.0113 (0.0250) 0.179 (0.138) Yes 784 0.045 Constant All Controls N R2 The dependent variable is a dummy which takes value 1 if child was absent at midline but present at endline and 0 if absent at mid and endline. The comparison group is students who were absent at mid and endline. Standard errors clustered at panchayat-level in parenthesis. Significance *** 1% **5% *10%.
Results - Mechanisms Both private and public schools students exercised school choice at endline Private Public School-grade level (3) 0.100** (0.045) 0.072** (0.030) School- grade level (6) 0.069*** (0.024) -0.000 (0.019) Student level (1) 0.068* (0.033) 0.116*** (0.038) Student level (4) 0.040* (0.021) 0.014 (0.020) (2) 0.024 (0.032) 0.183 (0.110) (5) 0.036 (0.025) 0.009 (0.068) Treatment Constant Student level controls School and village controls N R2 Yes Yes No Yes Yes No No 525 0.018 Yes 525 0.078 No 111 0.033 No 747 0.011 Yes 747 0.028 No 161 0.040 The sample consists of students whose households were surveyed. Standard errors clustered at panchayat-level in parenthesis. Significance *** 1% **5% *10%.
Results - Mechanisms But private schools students are less resource constrained and chose higher ranked schools Private Public T 1-3 0.023 (0.042) 0.070* (0.040) 0.069 (0.121) Yes 0.056 525 -0.017 (0.027) 0.036 (0.038) 0.004 (0.064) Yes 0.033 747 T4 Constant All controls R2 N The dependent variable equals 1 if the rank of child s school at endline is higher than school rank at baseline. School rank is based on student s overall score at the school and panchayat level at baseline. The sample consists of students whose households were surveyed. Standard errors clustered at panchayat-level in parenthesis. Significance *** 1% **5% *10%.
Robustness High and selective attrition All Private Proportion of baseline Public Proportion of baseline Proportion of baseline N N N Round 1 Rounds 1 and 2 Rounds 1 and 3 5157 4000 2996 2192 1825 1338 2965 2175 1658 78 58 83 61 73 56
Robustness Robust impact using inverse probability weights Private 0.420*** (0.115) 0.329*** (0.107) 0.241** (0.111) 0.487*** (0.118) 1338 Public -0.0617 (0.301) -0.0542 (0.077) -0.135 (0.109) -0.0948 (0.093) 1658 T1 T2 T3 T4 N
Robustness Robust impact using Lee bounds Private Public T1 T2 T3 T4 T1 T2 T3 T4 Lower bound -0.0125 (0.080) 0.266*** (0.087) -0.0743 (0.123) 0.0935 (0.086) -0.349*** (0.097) 0.132 (0.109) 0.163** (0.068) 0.486*** (0.060) -0.529*** (0.144) -0.232* (0.127) -0.118 (0.109) 0.0635 (0.127) -0.395*** (0.134) 0.0116 (0.154) -0.143 (0.135) 0.149 (0.117) Upper bound N 902 1002 973 938 1022 1381 1009 1122
Summary Test scores in private schools improve when both parents and schools know relative school quality. Public schools may not be able to adjust resources or have the incentive to respond. Public school students households respond on attendance and school choice but their response is not sufficient to improve learning outcomes. Private school students respond by exercising improved school choice.
Conclusions Providing relative information on student performance may lead to greater household responsiveness. Household pressure may be inadequate to incentivize schools to respond, at least in the short run.
