Evolution of Public Policies and Income Patterns: Insights from India
Comprehensive analysis of changing intergenerational support for elderly in India from 2004-05 to 2011-12, alongside initiatives like the Unorganized Sector Workers Social Security Act, the National Rural Employment Guarantee Act, and the National Rural Health Mission. The shift in per capita income relative to the mean per capita income of individuals aged 30-49 is also examined.
Download Presentation

Please find below an Image/Link to download the presentation.
The content on the website is provided AS IS for your information and personal use only. It may not be sold, licensed, or shared on other websites without obtaining consent from the author.If you encounter any issues during the download, it is possible that the publisher has removed the file from their server.
You are allowed to download the files provided on this website for personal or commercial use, subject to the condition that they are used lawfully. All files are the property of their respective owners.
The content on the website is provided AS IS for your information and personal use only. It may not be sold, licensed, or shared on other websites without obtaining consent from the author.
E N D
Presentation Transcript
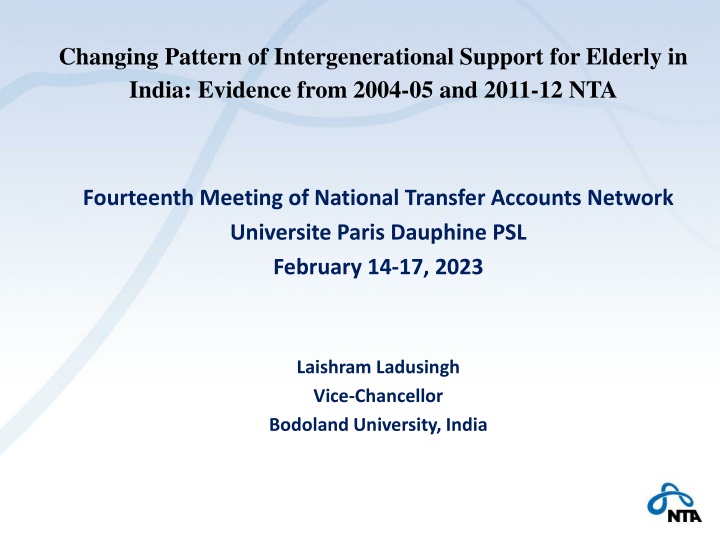
Changing Pattern of Intergenerational Support for Elderly in India: Evidence from 2004-05 and 2011-12 NTA Fourteenth Meeting of National Transfer Accounts Network Universite Paris Dauphine PSL February 14-17, 2023 Laishram Ladusingh Vice-Chancellor Bodoland University, India
Public Policies Initiaves Post 2005 Unorganized Sector Workers Social Security Act (USWSSA) 2008 - Provides life and disability cover, health and maternity benefits, old age protection - Schemes under the act includes Rashtriya Swasthya Bima Yojana (RSBY) by MoLE, Aam Admi Bima Yojana (AABY) by Department of Financial Services, Indira Gandhi National Old Age Pension Scheme( IGNOAPS) by MoRD - Single point of contact for unorganized sector workers to have access to social security and issued Smart Card
Public Policies Initiative Post 2005 The National Rural Employment Guarantee Act, 2005 Provides livelihood security of households in rural areas by providing minimum of 100 days employment in a year to adult members volunteer for unskilled manual work It is now renamed as MGNAREGA The Central Government bears the entire cost of unskilled manual workers, 75% cost of materials, skilled, semi-skilled workers and administrative cost The State Government bears 25% cost of materials, skilled and semi-skilled workers
Public Policies Initiaves Post 2005 National Rural Health Mission - Implemented during 2005-2012 to provide effective healthcare in the country with focus in 18 states with poor health indicators - National flagship program to meet then MDG -Strengthen health facilities more particularly in rural areas as par IPHS - Extended health outreach in villages through Panchayats and female health activist ASHA - Provide incentives for institutional maternal healthcare
Shift in Per Capita Income 1.4000 Relative to mean per capita income of 30-49 1.2000 1.0000 0.8000 years 2004-05 0.6000 2011-12 0.4000 0.2000 0.0000 0 5 10 15 20 25 30 35 40 45 50 55 60 65 70 75 80 85 90 Age
Changes in Per Capita Consumption 1.00 Relative to mean per capita income of 30-49 years 0.90 0.80 0.70 0.60 0.50 2011-12 0.40 2004-05 0.30 0.20 0.10 0.00 0 5 10 15 20 25 30 35 40 45 Age 50 55 60 65 70 75 80 85 90
Changing Lifecycle Deficit 1 0.8 Relative to men per capita income of 30-49 0.6 0.4 0.2 years 2011-12 0 0 2004-05 5 10 15 20 25 30 35 40 45 50 55 60 65 70 75 80 85 90 -0.2 -0.4 -0.6 -0.8 Age
Changes in Familial Support Net Intra-household Transfers Private Asset-based Reallocation 20.00 20.00 Relative to mean percapita income of 30-49 years Relative to mean percapita income of 30-49 years 15.00 15.00 10.00 10.00 5.00 5.00 0.00 0.00 0-19 20-29 30-49 50-64 65+ 0-19 20-29 30-49 50-64 65+ -5.00 -5.00 -10.00 -10.00 -15.00 -15.00 Pri_asset based_reallocation(2011-12) Net_priv_transfer (2011-12) Net_priv_transfer (2004-05) Priv_asset based_reallocation(2004-05)
Changing Consumption Share of Elderly Consumption 2004-05 2011-12 6.2 6.9 Public Total 8.9 9.5 Public Health 9.0 8.12 Private Total 14.2 10.3 Private Health Public Transfer 6.25 11.96 5.88 In Kind 8.76 In Cash
Changes in Support for LCD 120.0 7.1 8.3 100.0 Percent of Lifecycle Deficit 80.0 65.3 63.9 60.0 40.0 2.1 1.6 20.0 37.7 35.1 0.0 -8.9 -12.2 India(2004-05) India(2011-12) -20.0 Labour Income Familial Transfers Public Transfers Asset-based reallocation(Private) Asset-based reallocation (Public)
Change in LCD by Sex 1.00 Relative to to mean per capita income of 30-49 0.50 0.00 0 3 6 9 48 87 12 15 18 21 24 27 30 33 36 39 42 45 51 54 57 60 63 66 69 72 75 78 81 84 90+ years -0.50 -1.00 -1.50 -2.00 Men_LCD_2005 Men_LCD_2011 Women_LCD_2005 Women_LCD_2011
LCD by Social Groups 0.80 0.60 Relative to Average Labor Income of 30- 0.40 0.20 49 years of age 0.00 0 3 6 9 121518212427303336394245485154576063666972757881848790 -0.20 -0.40 -0.60 -0.80 -1.00 Age LCD SC 2005 LCD ST 2005 LCD SC 2011 LCD ST 2011
Thank You Thank You
