Evidence of Climate Change: Impacts and Trends
The evidence of climate change is clear from various indicators such as rising atmospheric CO2 levels, global sea level rise, increasing global temperatures since 1880, warming oceans, shrinking ice sheets in Greenland and Antarctica, declining Arctic sea ice, glacial retreat worldwide, and the increase in extreme weather events. These trends highlight the urgent need for action to mitigate the impacts of climate change.
Uploaded on Dec 14, 2024 | 0 Views
Download Presentation

Please find below an Image/Link to download the presentation.
The content on the website is provided AS IS for your information and personal use only. It may not be sold, licensed, or shared on other websites without obtaining consent from the author. Download presentation by click this link. If you encounter any issues during the download, it is possible that the publisher has removed the file from their server.
E N D
Presentation Transcript
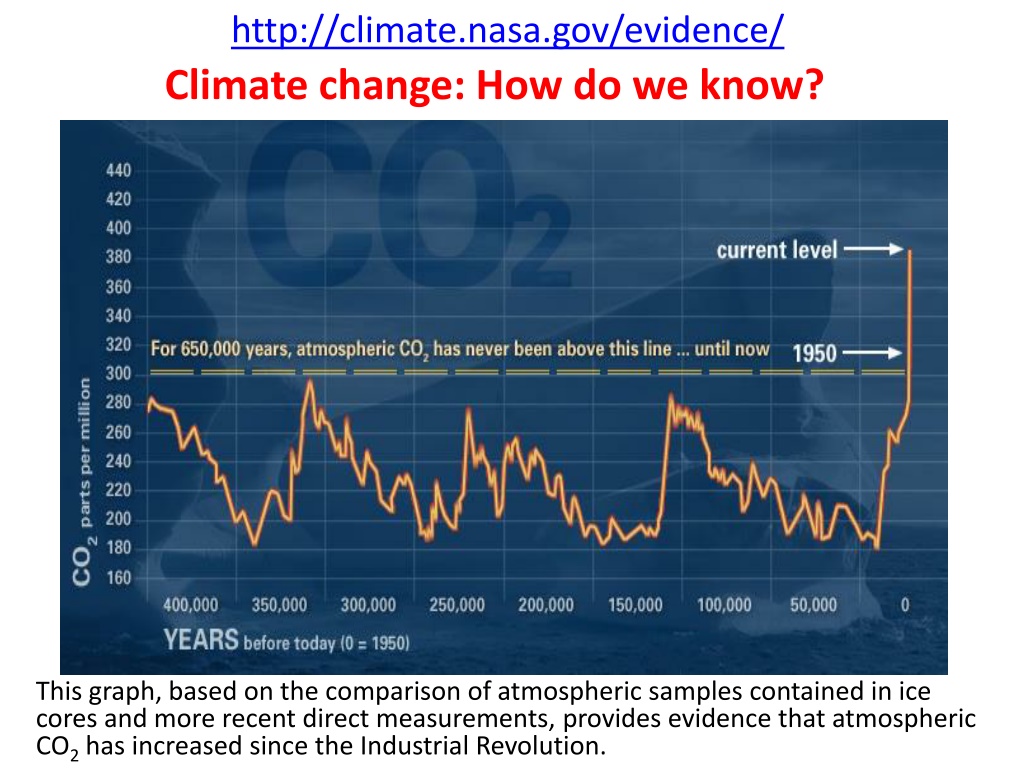
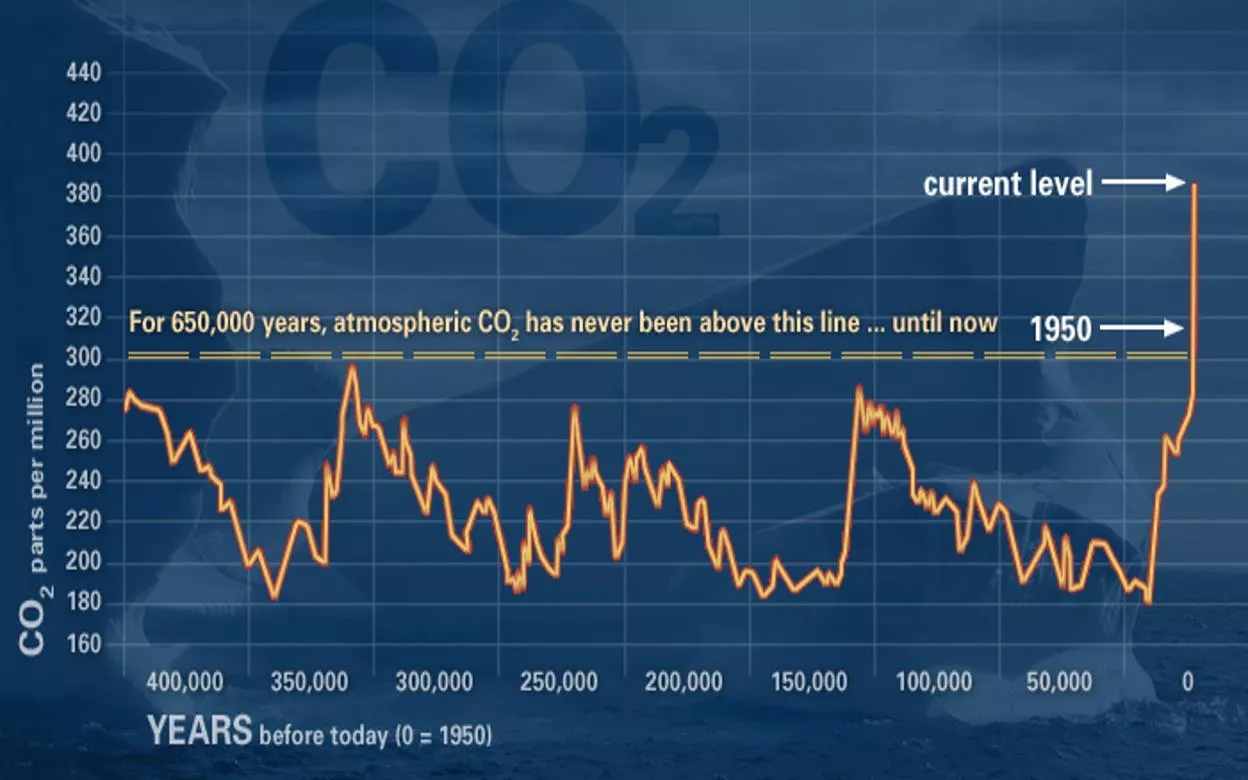
http://climate.nasa.gov/evidence/ Climate change: How do we know? This graph, based on the comparison of atmospheric samples contained in ice cores and more recent direct measurements, provides evidence that atmospheric CO2has increased since the Industrial Revolution.
Sea level rise Global sea level rose about 17 centimeters (6.7 inches) in the last century. The rate in the last decade, however, is nearly double that of the last century.
Global temperature rise All three major global surface temperature reconstructions show that Earth has warmed since 1880. Most of this warming has occurred since the 1970s, with the 20 warmest years having occurred since 1981 and with all 10 of the warmest years occurring in the past 12 years. Even though the 2000s witnessed a solar output decline resulting in an unusually deep solar minimum in 2007-2009, surface temperatures continue to increase.7
Warming oceans The oceans have absorbed much of this increased heat, with the top 700 meters (about 2,300 feet) of ocean showing warming of 0.302 degrees Fahrenheit since 1969.
Shrinking ice sheets The Greenland and Antarctic ice sheets have decreased in mass. Data from NASA's Gravity Recovery and Climate Experiment show Greenland lost 150 to 250 cubic kilometers (36 to 60 cubic miles) of ice per year between 2002 and 2006, while Antarctica lost about 152 cubic kilometers (36 cubic miles) of ice between 2002 and 2005.
Declining Arctic sea ice Both the extent and thickness of Arctic sea ice has declined rapidly over the last several decades.
Glacial retreat Glaciers are retreating almost everywhere around the world including in the Alps, Himalayas, Andes, Rockies, Alaska and Africa.10
Extreme events The number of record high temperature events in the United States has been increasing, while the number of record low temperature events has been decreasing, since 1950. The U.S. has also witnessed increasing numbers of intense rainfall events.11
Ocean acidification Since the beginning of the Industrial Revolution, the acidity of surface ocean waters has increased by about 30 percent. This increase is the result of humans emitting more carbon dioxide into the atmosphere and hence more being absorbed into the oceans. The amount of carbon dioxide absorbed by the upper layer of the oceans is increasing by about 2 billion tons per year.
