Estimating Available Area for Each Person on Earth
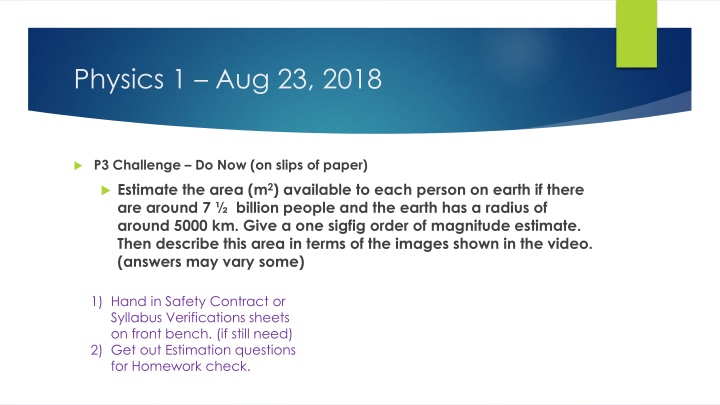
Consider estimating the area available per person on Earth based on a population of around 7 billion and the Earth's radius of approximately 5000 km using one significant figure. Relate this area to concepts discussed in the provided images, such as uncertainties in physics, accuracy, precision, and sources of error. Follow estimation techniques to arrive at a rough order of magnitude for the area per person.
Download Presentation

Please find below an Image/Link to download the presentation.
The content on the website is provided AS IS for your information and personal use only. It may not be sold, licensed, or shared on other websites without obtaining consent from the author.If you encounter any issues during the download, it is possible that the publisher has removed the file from their server.
You are allowed to download the files provided on this website for personal or commercial use, subject to the condition that they are used lawfully. All files are the property of their respective owners.
The content on the website is provided AS IS for your information and personal use only. It may not be sold, licensed, or shared on other websites without obtaining consent from the author.
E N D
Presentation Transcript
Physics 1 Aug 23, 2018 P3 Challenge Do Now (on slips of paper) Estimate the area (m2) available to each person on earth if there are around 7 billion people and the earth has a radius of around 5000 km. Give a one sigfig order of magnitude estimate. Then describe this area in terms of the images shown in the video. (answers may vary some) 1) Hand in Safety Contract or Syllabus Verifications sheets on front bench. (if still need) 2) Get out Estimation questions for Homework check.
Objectives and Agenda Objectives Agenda 1.2 Uncertainties and Errors Homework Review Cosmic Eye video Accuracy and Precision Sources of error Default Uncertainty Data Processing Assignment:IB 1.2 Uncertainty and Errors Practice Sheet, p1-2
Estimation Another common skill for any physics problem is to estimate the order of magnitude for your answer so you can judge whether your calculated answer is reasonable or not. To estimate, Round all quantities to (one sig fig with an order of magnitude) https://www.youtube.com/watch?v=0fKBhvDjuy0 Powers of 10 https://www.youtube.com/watch?v=jfSNxVqprvM Cosmic Eye Perform the needed calculation using your new simple numbers to find a one sigfig order of magnitude estimate of the answer. Ex: The frequency of visible light is between 430 nm and 770 nm and the speed of light is 3.00 x 10⁸ m/s. If the speed = frequency * wavelength, estimate the order of magnitude for the wavelength of visible light.
Accuracy and Precision Accuracy low % error how close is the Average to the Expected Precision small range how close are the data to each other
Types of Sources of Uncertainty Two Sources of uncertainty Systematic errors Random errors Systematic (should be minimized with careful attention to lab techniques) Instrumental (Ex: Every piece of measuring glassware has an uncertainty associated with it. Marked on the glassware.) Procedural (Ex: During a chemical processing, every transfer from one vessel to another creates some additional error) Tends to influence resulting data to be skewed in one direction
Types of Sources of Uncertainty Random Can never remove uncertainty because of the fundamentally random nature of the motion of atoms. Influence of the observer (uncertainty principle) Tends to increase uncertainty of a measurement in all directions. Error vs a mistake
Default uncertainty In any measurement there is an assumed level of uncertainty. Consider the last significant digit. The default uncertainty present is one half of the value of the last significant digit. For example: 5.7 m implies a measurement between 5.65 and 5.75, or any of the many possible numbers that could have been rounded to 5.7. This corresponds to a default uncertainty of 0.05 m. The standard format for reporting a quantity with a stated uncertainty is: 5.7 0.05 m Uncertainties are always reported with only one sigfig. The unit is given only once.
Practice Assess the uncertainty in the following and report the values with their uncertainty 32.3 kg 0.32 cm 15.72 mL
Data Analysis After you perform experimental trials as outlined by a design, you will have a data set to analyze with several observations of the same event. Average result Compare to a known or expected result using a percent error. % ????? =??????? ???????? ??? ???????? A quick estimate of uncertainty can be of range (max min)/2 This is the type of uncertainty IB expects you to use on papers 1-3. Standard Deviation is used to determine uncertainty. To use for your IA projects. May use a graph to show relationships between variables.
Standard Deviation A better measure of variability in a set of data is the standard deviation. To calculate: 1) Find the average of the data. ? 2) Find the difference between each datum and the average ?? ? 3) Square the differences ?? ? ? 4) Add up all of the squares ?? ? ? ? Not specifically tested on IB, but a need to know for the IA. Don t use the calculator shortcut until you can do it yourself. 5) Divide by one less than the number of data ?? ? ? ? ? ?? ? ? ? 6) Take the square root of the ans.
Find average and standard deviation 85.62 m 84.87 m 85.31 m 85.21 m 83.91 m 84.97 m 84.22 m 84.14 m 85.18 m 84.87 m Possible data set for stopping distances measured by a computer sensor. 1) Find the average 2) Find the standard deviation by hand 3) Check your answer with the stat func 1-var calcs on a graphing calculator (larger sample std listed as Sx) 4) Express your best guess rounded to the proper number of sigfigs with its associated uncertainty. (Report uncertainty to 1 sigfig, then round value to same decimal place.)
Exit Slip - Assignment Exit slip None What s Due? (Pending assignments to complete.) IB 1.2 Uncertainty and Errors Practice Sheet, p1-2 What s Next? (How to prepare for the next day) Read IB 1.2 p 11-20
