Erging Techniques and Benefits


To Erg or Not to Erg
Landis Walsh
Biology 438
3.31.16

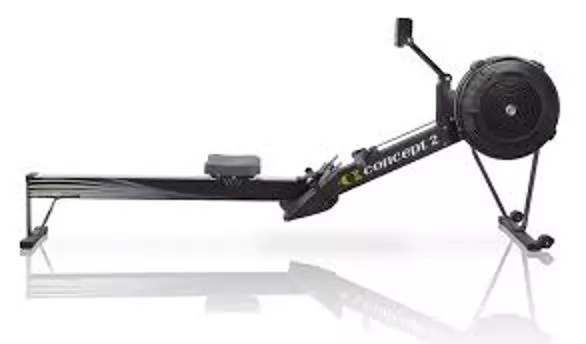
What is Erging
•
Cross-Fit tool
•
Training tool for rowers
•
Terminology
•
Drive vs. Recovery
•
Catch vs. Finish
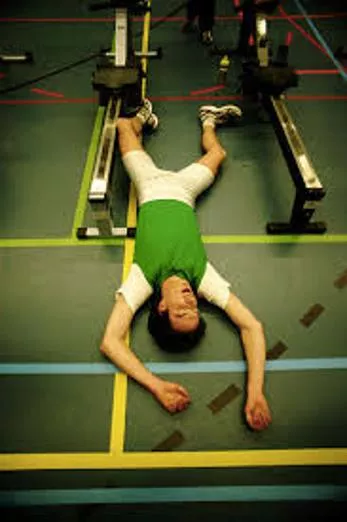
Amateur Example
Why Should You Care?
•
From a training perspective
From a training perspective
•
Reduced force generation limits power output
Reduced force generation limits power output
•
Reduces training benefit
Reduces training benefit
•
One trains the wrong muscles
One trains the wrong muscles
•
From a safety perspective
From a safety perspective
•
Improper form can put unwanted stress on other muscles
Improper form can put unwanted stress on other muscles
•
For Example: eccentric force/load
For Example: eccentric force/load
Questions
•
How does proper form affect force output on
the erg?
•
Will force output change?
•
Do the biomechanics change?
How does the erg calculate
watts?
•
Watts=2.8/pace
Watts=2.8/pace
3
3
•
Pace determined from physics principles
Pace determined from physics principles
•
Machine measures rate of acceleration of flywheel during
Machine measures rate of acceleration of flywheel during
stroke and its deceleration
stroke and its deceleration
•
Using this and and known
Using this and and known
Moment of Inertia,
Moment of Inertia,
can calculate
can calculate
speed, power, distance, energy usage
speed, power, distance, energy usage
•
Pace is time is takes to move 500 meters
Pace is time is takes to move 500 meters
•
Physics:
Physics:
•
I=mr
I=mr
2
2
•
T= (radius)(F)=(mαx radius)(radius)=Iα
T= (radius)(F)=(mαx radius)(radius)=Iα
Methods
•
Filmed at 240 frames/second
•
Frequency of stroke and recovery approximately set to 30
strokes/minute
•
Analysis of
Drive
only
•
Logger Pro- one out of every 10 frames were analyzed
•
Adjusted Origin- Plane was uneven on both
•
Assumptions: Point at which drive began and ended, participants
were approximately same height and weight, same
total
frequency,
generalizations about average power produced
•
Calculations through Excel
Data: Videos
Analysis: Logger Pro
Analysis: The Handle
•
Why the handle?
Why the handle?
•
Where generation of force is measured by the erg:
Where generation of force is measured by the erg:
Novice:
•
Total Horizontal
Distance=2.23m
•
Total Time/Stroke
=0.917 seconds
•
Average power
produced during stroke
=250 watts
•
Average Force
generation= 105
Newtons
Experienced:
•
Total Horizontal
Distance=2.24m
•
Total Time/Stroke
=0.792 seconds
•
Average power
produced during stroke
= 435 watts
•
Average Force
generation= 156
Newtons
Data: The Handle
Conclusions: The Handle
•
Experienced generates more force: 156 N vs. 105 N
•
Experienced rower reaches
max velocity
earlier
•
Max Velocity only slightly greater for novice (3.37 vs. 3.33 m/s)
•
Smaller decrease in velocity towards end of drive
•
2.20 vs. 2.64 m/s
•
Holding speed for longer period of time
•
Note less time spent on drive for experienced (0.792 vs.0.917 s)
•
Almost 15% less time spent on drive
•
While total frequency remains approximately the same (30-31spm)
•
More time spent relaxing for experienced
What is Happening?
•
Clearly, novice rower cannot match all of the physical
Clearly, novice rower cannot match all of the physical
parameters of experienced rower
parameters of experienced rower
•
But why?
But why?
•
Two biomechanical parameters that were measured:
Two biomechanical parameters that were measured:
•
Hips
Hips
•
Shoulders
Shoulders
Analysis: Hips
Novice:
•
Total Horizontal Motion=
0.827m
•
Vertical Motion
•
Up- 0.010m
•
Down- 0.042 m
•
Max velocity= 1.88 m/s
•
Max decelerating velocity= -
0.066m/s
Experienced:
•
Total Horizontal Motion=
0.560m
•
Vertical Motion
•
Down- 0.082 m
•
Max velocity= 1.33 m/s
•
Max decelerating
velocity= -0.002m/s
Data: Hips
Conclusions: Hips
•
Experienced rower reaches maximum velocity faster
•
0.209 seconds vs. 0.375 seconds
•
Novice Rower decelerates towards end of stroke more than
experienced rower
•
-0.066 vs. -0.002 m/s
•
Novice rower wastes more energy on vertical displacement
•
Up and down motion
•
More horizontal motion (0.827 vs. 0.563m)
•
Due to more upright position at
catch
Analysis: Shoulders
Novice:
•
Horizontal Distance
traveled=1.59 m
•
Vertical Motion
•
Up- 0.013m
•
Down- 0.296 m
•
Max Velocity=2.75 m/s
•
Lull in velocity from
0.333-0.417 seconds
Experienced:
•
Horizontal Distance
traveled=1.60 m
•
Vertical Motion
•
Up- 0.063m
•
Down- 0.314 m
•
Max Velocity=2.76 m/s
•
No observed lull in velocity
Data: Shoulders
Conclusion: Shoulders
•
Novice “throws” the shoulders
•
Suggested by decrease and then increase in velocity
•
Both rowers have similar shoulder ”stroke” length
•
1.60 vs. 1.59 m
•
Both exhibit pendulum motion
•
Max Velocity very similar
•
2.75 vs. 2.76 m/s
Quick Recap
•
Experienced Rower generated about 1.5x as much average
force/stroke
•
But why?
•
Handle:
•
Experienced rower spends 15% less time on
drive
•
Holds max velocity for a greater period of time
•
Shoulders:
•
Novice rower generates force by throwing shoulders
•
Hips:
•
Novice rower wastes more energy in vertical displacement
•
Decelerates more at finish and more upright at catch
Future Directions
•
Add force plates to the Erg
•
Analyzing generation of force over time more accurately
•
Instantaneous watts
•
Analyzing force generation with respect to position in drive
•
Analyze Angular Back displacement
•
Does setting your back position at different angles help?
Acknowledgements
•
Dr. Berner, Dr. Rome, and Dr. Nelson
•
Penn Multimedia Department
Data: Videos
Data: Videos
Analysis: Logger Pro
Enhance your rowing performance with proper erging form. Learn about force output, biomechanics, and power calculation on the erg machine. Discover the significance of safety considerations and see real amateur examples illustrating the importance of erging correctly.

Download Presentation

Please find below an Image/Link to download the presentation.
The content on the website is provided AS IS for your information and personal use only. It may not be sold, licensed, or shared on other websites without obtaining consent from the author.If you encounter any issues during the download, it is possible that the publisher has removed the file from their server.
You are allowed to download the files provided on this website for personal or commercial use, subject to the condition that they are used lawfully. All files are the property of their respective owners.
The content on the website is provided AS IS for your information and personal use only. It may not be sold, licensed, or shared on other websites without obtaining consent from the author.
E N D
Presentation Transcript
To Erg or Not to Erg Landis Walsh Biology 438 3.31.16
What is Erging Cross-Fit tool Training tool for rowers Terminology Drive vs. Recovery Catch vs. Finish
Why Should You Care? From a training perspective Reduced force generation limits power output Reduces training benefit One trains the wrong muscles From a safety perspective Improper form can put unwanted stress on other muscles For Example: eccentric force/load
Questions How does proper form affect force output on the erg? Will force output change? Do the biomechanics change?
How does the erg calculate watts? Watts=2.8/pace3 Pace determined from physics principles Machine measures rate of acceleration of flywheel during stroke and its deceleration Using this and and known Moment of Inertia, can calculate speed, power, distance, energy usage Pace is time is takes to move 500 meters Physics: I=mr2 T= (radius)(F)=(m x radius)(radius)=I
Methods Filmed at 240 frames/second Frequency of stroke and recovery approximately set to 30 strokes/minute Analysis of Drive only Logger Pro- one out of every 10 frames were analyzed Adjusted Origin- Plane was uneven on both Assumptions: Point at which drive began and ended, participants were approximately same height and weight, same total frequency, generalizations about average power produced Calculations through Excel
Analysis: The Handle Why the handle? Where generation of force is measured by the erg: Novice: Experienced: Total Horizontal Distance=2.23m Total Time/Stroke =0.917 seconds Average power produced during stroke =250 watts Average Force generation= 105 Newtons Total Horizontal Distance=2.24m Total Time/Stroke =0.792 seconds Average power produced during stroke = 435 watts Average Force generation= 156 Newtons
Data: The Handle Experienced: Handle Velocity vs. Time 3.5 3 2.5 Velocity (m/s) 2 1.5 1 0.5 0 0 0.1 0.2 0.3 0.4 0.5 0.6 0.7 0.8 0.9 1 Time (seconds) Novice: Horizontal Handle Velocity vs. Time 4 3.5 3 Velocity (m/s) 2.5 2 1.5 1 0.5 0 0 0.1 0.2 0.3 0.4 0.5 0.6 0.7 0.8 0.9 1 Time (Seconds)
Conclusions: The Handle Experienced generates more force: 156 N vs. 105 N Experienced rower reaches max velocity earlier Max Velocity only slightly greater for novice (3.37 vs. 3.33 m/s) Smaller decrease in velocity towards end of drive 2.20 vs. 2.64 m/s Holding speed for longer period of time Note less time spent on drive for experienced (0.792 vs.0.917 s) Almost 15% less time spent on drive While total frequency remains approximately the same (30-31spm) More time spent relaxing for experienced
What is Happening? Clearly, novice rower cannot match all of the physical parameters of experienced rower But why? Two biomechanical parameters that were measured: Hips Shoulders
Analysis: Hips Novice: Experienced: Total Horizontal Motion= 0.827m Total Horizontal Motion= 0.560m Vertical Motion Up- 0.010m Down- 0.042 m Vertical Motion Down- 0.082 m Max velocity= 1.88 m/s Max velocity= 1.33 m/s Max decelerating velocity= - 0.066m/s Max decelerating velocity= -0.002m/s
Data: Hips Experienced: Horizontal Hip Velocity vs. Time 2 1.5 Velocity (m/s) 1 0.5 0 0 0.1 0.2 0.3 0.4 0.5 0.6 0.7 0.8 0.9 1 -0.5 Time (Seconds) Novice: Horizontal Hip Velocity vs. Time 2 1.5 Velocity (m/s) 1 0.5 0 0 0.1 0.2 0.3 0.4 0.5 0.6 0.7 0.8 0.9 1 -0.5 Time (Seconds)
Conclusions: Hips Experienced rower reaches maximum velocity faster 0.209 seconds vs. 0.375 seconds Novice Rower decelerates towards end of stroke more than experienced rower -0.066 vs. -0.002 m/s Novice rower wastes more energy on vertical displacement Up and down motion More horizontal motion (0.827 vs. 0.563m) Due to more upright position at catch
Analysis: Shoulders Novice: Experienced: Horizontal Distance traveled=1.59 m Horizontal Distance traveled=1.60 m Vertical Motion Up- 0.013m Down- 0.296 m Vertical Motion Up- 0.063m Down- 0.314 m Max Velocity=2.75 m/s Max Velocity=2.76 m/s Lull in velocity from 0.333-0.417 seconds No observed lull in velocity
Data: Shoulders Experienced: Horizontal Shoulder Velocity vs. Time 3 2.5 Velocity (m/s) 2 1.5 1 0.5 0 0 0.1 0.2 0.3 0.4 0.5 0.6 0.7 0.8 0.9 1 Time (Seconds) Novice: Horizontal Shoulder Velocity vs. Time 3 2.5 Velocity (m/s) 2 1.5 1 0.5 0 0 0.1 0.2 0.3 0.4 0.5 0.6 0.7 0.8 0.9 1 Time (Seconds)
Conclusion: Shoulders Novice throws the shoulders Suggested by decrease and then increase in velocity Both rowers have similar shoulder stroke length 1.60 vs. 1.59 m Both exhibit pendulum motion Max Velocity very similar 2.75 vs. 2.76 m/s
Quick Recap Experienced Rower generated about 1.5x as much average force/stroke But why? Handle: Experienced rower spends 15% less time on drive Holds max velocity for a greater period of time Shoulders: Novice rower generates force by throwing shoulders Hips: Novice rower wastes more energy in vertical displacement Decelerates more at finish and more upright at catch
Future Directions Add force plates to the Erg Analyzing generation of force over time more accurately Instantaneous watts Analyzing force generation with respect to position in drive Analyze Angular Back displacement Does setting your back position at different angles help?
Acknowledgements Dr. Berner, Dr. Rome, and Dr. Nelson Penn Multimedia Department