EPA Pipeline Protocols and Leak Detection Methods
Explore the differences between the original 1990 EPA Pipeline Protocol and the 2016 modified version. Learn about pipeline leak detection methods such as volume displacement and pressure decay, along with the theoretical models used to predict pressure changes associated with leaks in underground storage tank pipelines. Discover essential information on testing procedures, test durations, and waiting periods for effective leak detection.

Download Presentation

Please find below an Image/Link to download the presentation.
The content on the website is provided AS IS for your information and personal use only. It may not be sold, licensed, or shared on other websites without obtaining consent from the author.If you encounter any issues during the download, it is possible that the publisher has removed the file from their server.
You are allowed to download the files provided on this website for personal or commercial use, subject to the condition that they are used lawfully. All files are the property of their respective owners.
The content on the website is provided AS IS for your information and personal use only. It may not be sold, licensed, or shared on other websites without obtaining consent from the author.
E N D
Presentation Transcript
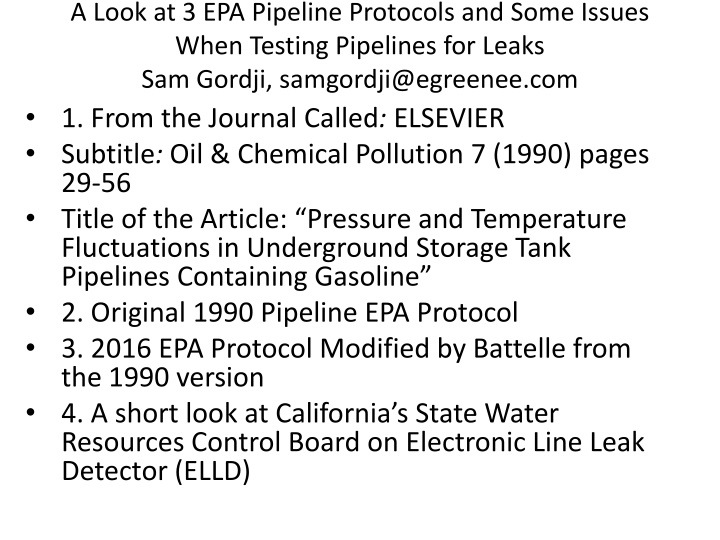
A Look at 3 EPA Pipeline Protocols and Some Issues When Testing Pipelines for Leaks Sam Gordji, samgordji@egreenee.com 1. From the Journal Called: ELSEVIER Subtitle: Oil & Chemical Pollution 7 (1990) pages 29-56 Title of the Article: Pressure and Temperature Fluctuations in Underground Storage Tank Pipelines Containing Gasoline 2. Original 1990 Pipeline EPA Protocol 3. 2016 EPA Protocol Modified by Battelle from the 1990 version 4. A short look at California s State Water Resources Control Board on Electronic Line Leak Detector (ELLD)
A Quick Look at the 3 Protocols and an Investigate in to their Relationship to Each other Here the Original EPA Paper is referred to the paper published in ELSEVIER The 1990 Pipeline Protocol has its origin and its roots in the Original EPA Paper. There are several figures that are copied from the original EPA paper to 1990 Protocol. Two of the figures copied from the Original EPA Paper are on pages 14 and 45 of the 1990 Pipeline Protocol
Methods of Pipeline Leak Detection (1) Volume Displacement, (2) Pressure Decay Since the presence of leaks in pressurized under ground storage tank (UST) pipeline systems will cause the pressure to decay in the lines, pipeline leak detection is generally performed by monitoring pressure in the line Also, the leak detection could be measured by loss in volume Both methods require that the volume measured must not exceed a pre-determined limit (e.g., 0.2 gph) or the Electronic Line Leak Detector (ELLD) will declare a leak.
Abstract of the Paper Published in ELSEVIER A common method of detecting a small leak in a pressurized underground storage tank pipeline system containing petroleum is to monitor the pressure in the line. This paper presents theoretical models to predict the pressure changes associated with leaks and product temperature changes in pressurized pipelines. These models have been validated in experiments at retail petroleum facilities and the EPA's UST Test Apparatus. A heat conduction model is used to estimate the waiting period prior to the beginning of the test that is long enough to allow the product temperature changes to be negligibly small, and an exponential pressure-decay model is used to estimate the test duration that allows the pressure drop associated with small leaks to exceed the threshold. The results suggest that a test duration of 15 to 60 min is required to detect leaks as small as 0.1 gal/h and a waiting period of up to 6 to 12 hours is required for the temperature changes in a 2-inch diameter pipeline to be negligible aider the last dispensing of product through the line.
Differences Between 1990 and 2016 Versions of the EPA Pipeline Protocol While the original 1990 EPA Pipeline protocol has 103 pages, the draft EPA copy of 2016 Pipeline Protocol is only 43 pages. Some important concepts has been deleted from the 2016 version The Statistical approach to finding the leak has also been changed in the 2016 version
Some Definitions From 1990 Pipeline Protocols Bulk modulus: Every material has its own bulk modulus and is the ratio of change in pressure to fractional change in volume, or K=V*dP/dV. Compressibility: Is the inverse of bulk modulus and is the fractional change in volume resulting from a unit change in pressure or dV/dP. Example: Certain oil has a bulk modulus of 3.0 x 10⁵psi. Thus, a pressure increase of 3000 psi will reduce its volume by 1.0%, or 3000psi/3.0*10^5= 1.0% Water is essentially incompressible, especially under normal conditions. Air is about 15,000 times as compressible as water.
More on Compressibility and Bulk Modulus Compressibility is the inverse of the bulk modulus. A material which is tough to compress has a huge bulk modulus, but a lesser compressibility. An element has a high compressibility but a low bulk modulus when it is easy to compress. Some K values: Water, K=2.15*10^9N/m^2 For Steel K=1.6*10*11 For some oil, K=1.62*10*9 Stainless steel with Bulk Modulus 163 109Pa is aprox. 80 times harder to compress than water with Bulk Modulus 2.15 109Pa(N/m2). Pa is Pascal
Leaks from Pipelines systems Are Higher Than Leaks from USTs Most surveys agree that the majority of all leaks in UST systems occur not in the tanks themselves but in the associated piping (page 30 of ELSEVIER) Most commercially available systems claim to be able to reliably detect leak rates as small as 0.05 gal/h. The API and EPA work suggests that these claims are not being met (page 34 of ELSEVIER) Because the pipeline system is pressurized, a large release of product can occur over a very short period of time. Assuming the conversion formula of height=psi/.433 and the pressure of 30 psi for a pipeline, height equivalent is 30/.433=69 ft compared to a tank with the diameter of say 10ft. For the same size hole the leak is a lot higher
Issues with the Pipelines Continued To have a feel for 30 psi, most passenger car tires have pressures of about 35-40 psi. According to the EPA testing should be done at 150% of 30psi which is 45psi
Why It Is So Problematic to Find a Leak in the Pipelines Because temperature, pressure, and volumes all play a role and one effects the other ones, this is called coupling of two or more substances For example, when the temperature increases volume increase and when pressure increases volume decrease and so on. This dependence makes it difficult to find the actual leak These couplings sometimes can mask a leak Fiberglass pipeline expansion can increase the volume of the pipelines under pressure Air bubbles in the line that caus the volume to decrease under pressure
From Page 26 of 1990 Pipeline Notice as Pressure Increase the Volume Gets Smaller at a Faster Rate for the Pipeline Containing Vapor
Development of Empirical Model for Leak Exponential models were developed in Maresca et al. 1988 as temporal descriptions for the pressure change, volume change, and flow rate resulting from a leak in the line. These models are described by the following equations: P(t) = P0*(e-(B*L0*t))/(P0*V0) (1) Above is the expression for pressure at time t, simply multiply this by V0/B and we obtain the expression for Volume at any given time Vc(t)= (V0*P0/B)*( e-(B*L0*t)/(P0*V0)) And finally by taking the derivative of Vc(t), the leak rate is obtained L(t)= d Vc(t)/dt = -d((V0/B)( P0*e-(B*L0*t)/(P0*V0))/dt L(t) = - dV/dt = -L0*(e^-(B*L0*t))/(P0*V0)
Development of Empirical Model for Obtaining Leak By inspecting equation 1 on page 35 of the Original EPA Paper we can tell that as time increases the pressure decreases
Development of Empirical Model for Obtaining Leak From page 35 of 1990 ELSEVIER Equation one is empirical equation obtained by experiment Equation one multiplied by V0/B will yields the expression for volume Vc Volume divided by time will yield the leak rate at time t, L(t)= dV/dt at some time t Any variable with the subscript of 0 is the initial value, e.g. V0and P0are the initial volume and pressure and so on dV/dT means the change in volume respect to time, e.g. an 8000 gallon tank loses 2.4 gallons in 24 hours, represents dV/dT = 2.4/24 = .1 gallons per hour. If there is no differences in two volumes we have NO LEAK
Programming of the Reproduction of the Pressure drop from page 37 of 1990 ELSEVER Journal
Pressure Versus Lost Product Fig. 1 and Fig. 2 Measured and Modeled Pressure Versus Time From Page 37, 1990 ELSEVIER
Fig. of the Experimental apparatus Fig. 3 from page 38 of ELSEVIER on the following slide shows as the leak gets larger the drop in the pressure increases The lines of pressure drops are parallel
P38, Pressure Versus Time. When the leak is 0 the line is straight, No pre. drop & higher leaks More Pressure Drop
Conclusion & Improving the accuracy of the System The main cause of volume change, if there is not a leak in the pipelines, is the thermal expansion and contraction (page 47) Since Steel has a higher bulk density than fiberglass, (when possible) pipelines should be constructed from steel with the highest bulk density whenever possible If possible the pipeline should be installed deeper into the ground to avoid the daily and the seasonally changes of temperature Thank you. Email me for a copy of the Presentation


 Volume")