Enhancing Poverty Measurement Efforts
Detailed data collection for poverty measurement can be time-consuming and challenging. Policymakers face constraints in understanding economic developments due to data limitations. This World Bank initiative aims to improve the timeliness and frequency of poverty data through innovative approaches.
Download Presentation

Please find below an Image/Link to download the presentation.
The content on the website is provided AS IS for your information and personal use only. It may not be sold, licensed, or shared on other websites without obtaining consent from the author.If you encounter any issues during the download, it is possible that the publisher has removed the file from their server.
You are allowed to download the files provided on this website for personal or commercial use, subject to the condition that they are used lawfully. All files are the property of their respective owners.
The content on the website is provided AS IS for your information and personal use only. It may not be sold, licensed, or shared on other websites without obtaining consent from the author.
E N D
Presentation Transcript
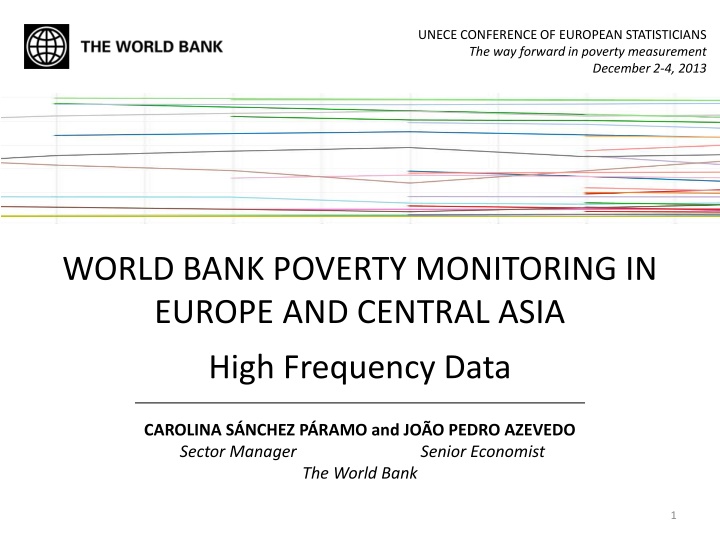
UNECE CONFERENCE OF EUROPEAN STATISTICIANS The way forward in poverty measurement December 2-4, 2013 WORLD BANK POVERTY MONITORING IN EUROPE AND CENTRAL ASIA High Frequency Data CAROLINA S NCHEZ P RAMO and JO O PEDRO AZEVEDO Sector Manager The World Bank Senior Economist 1
OVERVIEW The Situation The Challenge The Background The Solution Moving Forward 2
THE SITUATION Collection of detailed consumption or income data can be very time-consuming, costly, and difficult. The median frequency of poverty microdata in the last 10 years in the World Bank World Development Indicators (WDI) is 13 countries per year in ECA. As a result Some data have lags in reporting time of up to several years 25 21 20 19 20 18 Some data do not exist or are not accessible 17 17 16 15 15 13 13 1011 9 10 8 Some data are not comparable 5 1 1 1 0 1995 1997 1998 1999 2000 2001 2002 2003 2004 2005 2006 2007 2008 2009 2010 2011 2012 3 World Bank Poverty Monitoring In Europe And Central Asia : High Frequency Data
THE CHALLENGE Policy makers need to understand the consequences of time sensitive economic developments in order to design appropriate responses. Kitchen Restaurant icon Shopping Money bag icon Plants Leaf icon FOOD CRISIS ENVIRONMENTAL SHOCK FINANCIAL CRISIS How can we do this given data constraints? 4 World Bank Poverty Monitoring In Europe And Central Asia : High Frequency Data
THE BACKGROUND Western Balkans Programmatic Poverty Assessment DG EMPL- World Bank Joint Technical Workshop on High Frequency Welfare Monitoring June 2013 One day workshop to take stock of ongoing efforts to address this problem by the European Commission, Eurostat, Academics, Member States, and the World Bank. 5 World Bank Poverty Monitoring In Europe And Central Asia : High Frequency Data
THE SOLUTION Time Clock icon Improve timeliness of existing data Charts Combo chart icon Leverage existing data to create new data Basic Idea icon Collect new data or collect old data in new ways 6 World Bank Poverty Monitoring In Europe And Central Asia : High Frequency Data
IMPROVE TIMELINESS OF EXISTING DATA Time Clock icon 7 World Bank Poverty Monitoring In Europe And Central Asia : High Frequency Data
NSO CAPACITY BUILDING Collecting Processing Archiving Disseminating Current initiatives Best practices Resources for NSOs 8 World Bank Poverty Monitoring In Europe And Central Asia : High Frequency Data
Charts Combo chart icon LEVERAGE EXISTING DATA TO CREATE NEW DATA 9 World Bank Poverty Monitoring In Europe And Central Asia : High Frequency Data
POVERTY PROJECTIONS: AGGREGATE Backcasting, nowcasting, & forecasting to fill in missing surveys according to macroeconomic and population historical figures and projections. SUSTAINABLE OPEN MODULAR 10 World Bank Poverty Monitoring In Europe And Central Asia : High Frequency Data
POVERTY PROJECTIONS: MICRO Baseline Assessment of impacts Simulation Micro data Price data Input Macro projections estimate adjust predict in LF status (ind) real earnings (ind) remittances (HH) LF status model Earnings equation Migration/remittances Income and consumption (individuals and HH) Output Population Results Population growth Income/consumption distributions Poverty and inequality measures Rule: Replicate macro proportional changes at micro level Rule: Best fit to micro data 11 World Bank Poverty Monitoring In Europe And Central Asia : High Frequency Data
SURVEY TO SURVEY IMPUTATIONS More frequent and simple surveys, like Labor Force Survey Household Budget Survey =F(X) X C X Develop imputation model Regress C on X C: Consumption X: Other indicators like employment, education =F(X): Imputed (or predicted) Consumption C=F(X) 12 World Bank Poverty Monitoring In Europe And Central Asia : High Frequency Data
EXPECTATIONS DATA Predicting welfare using small area estimation techniques to create a model of consumption based on a large household survey and applying parameter estimates to Consumer Expectations Survey data. Source: Kuzmanovi and Sanfey (2012). 13 World Bank Poverty Monitoring In Europe And Central Asia : High Frequency Data
INTERNET-BASED DATA 14 Using web-search query data to model real world phenomena and nowcast current welfare indicators. Upload to Google Correlate and obtain related search terms Segment the time series (training data & validation data) Prepare the time series of interest (e.g. poverty rates) Factorial algorithm Use Granger Causality Test to choose predictors Best model with smallest RMSE Stepwise Regression Create the baseline model (ARIMA; Seasonal ARIMA) Compare two selected models World Bank Poverty Monitoring In Europe And Central Asia : High Frequency Data
Basic Idea icon COLLECT NEW DATA OR COLLECT OLD DATA IN NEW WAYS 15 World Bank Poverty Monitoring In Europe And Central Asia : High Frequency Data
MOBILE PHONES: NEW DATA Conducting mobile phone surveys to generate new data. Probabilistic sampling Panel survey Pilot testing impact of incentives on the response rate and the actual answer F2F Final Wave 6 Wave 1 Pilot testing reliability and attrition rates of different survey modes F2F Initial 16 World Bank Poverty Monitoring In Europe And Central Asia : A Harmonization Effort
MOBILE PHONES: AUGMENTING DATA With simplified questions, cell phones and tablets can be used to collecting data quickly and produce poverty estimates in existing frequent household surveys, like LFS. HBS can be used to create a model: Y = ?(?) ? can be collected by telephone interview A critical assumption of the survey-to-survey imputation is: ????= ?? Experiment in Serbia to test whether responses to questionnaire changes based on the interview mode 17 World Bank Poverty Monitoring In Europe And Central Asia : A Harmonization Effort
MOVING FORWARD Best practice methodologies Innovation and experimentation Working with NSOs Knowledge sharing Training Capacity building 18 World Bank Poverty Monitoring In Europe And Central Asia : A Harmonization Effort
THANK YOU. CAROLINA S NCHEZ P RAMO csanchezparamo@worldbank.org JO O PEDRO AZEVEDO jazevedo@worldbank.org 19 World Bank Poverty Monitoring In Europe And Central Asia : High Frequency Data
