Efficient Water Delivery System for Farmers
This project focuses on creating a canal network control system to deliver water on-demand with high flow rates to farmers. Key objectives include maintaining canal levels, managing potential leakages, and addressing various issues such as seepage and human error. The system's control parameters, controlling elements, major disturbances, constraints, modes of operation, and modes of control are detailed to ensure effective water management for agricultural purposes.
Uploaded on Sep 13, 2024 | 3 Views
Download Presentation

Please find below an Image/Link to download the presentation.
The content on the website is provided AS IS for your information and personal use only. It may not be sold, licensed, or shared on other websites without obtaining consent from the author.If you encounter any issues during the download, it is possible that the publisher has removed the file from their server.
You are allowed to download the files provided on this website for personal or commercial use, subject to the condition that they are used lawfully. All files are the property of their respective owners.
The content on the website is provided AS IS for your information and personal use only. It may not be sold, licensed, or shared on other websites without obtaining consent from the author.
E N D
Presentation Transcript
CANAL NETWORK CONTROL akbasu48@gmail.com AJAY K BASU
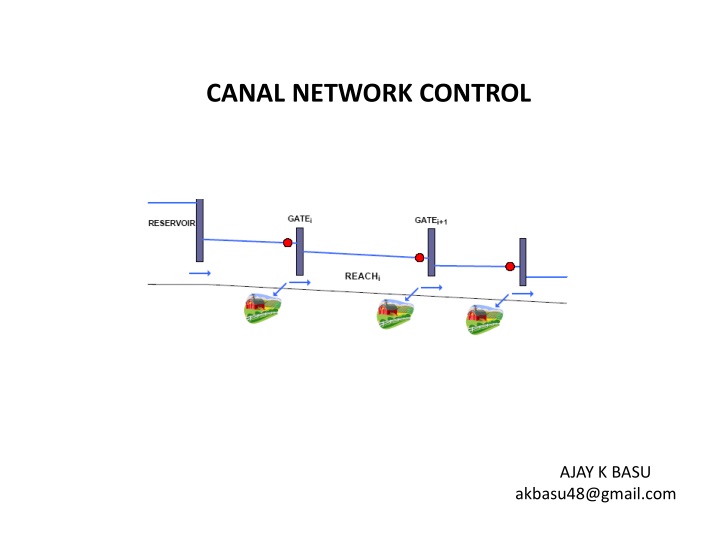
Objective To reliably deliver water on-demand, with high flow rates to all farmers To guarantee flows requested by users. It is necessary to maintain the level of the canal over the off-take gate.
Objective To reliably deliver water on-demand, with high flow rates to all farmers To guarantee flows requested by users. It is necessary to maintain the level of the canal over the off-take gate.
Issues - Known or unknown leakage - Seepage - Unexpected weather - Long Canal network - Stake holders - Human error
Control Parameters Upstream or downstream levels at the gates. Water flow through gates, mainly at the head of the canal and secondary canals. Water volume
Controlling Elements Gate opening Flow can be considered as a secondary controlling element to control levels when a two level controller is used.
Major disturbances Off take flow actual and predicted Rain fall actual and predicted
Constraints - Maximum and minimum levels along the canal - Maximum and minimum flows - Operating levels at the tail of the canal
Modes of operation - Demand oriented - Supply oriented
Modes of control - Upstream control - Downstream control
Downstream Control Control structure adjustments (gates) are based upon information from downstream (usually levels) Downstream control transfers the downstream off take demand to the upstream water supply source (flow at the head) Compatible with demand oriented operation Impossible with supply oriented operation
Upstream Control Control structure adjustments (gates) are based upon information from upstream (usually levels) Upstream control transfers the upstream water supply (or inflow) downstream to points of diversion or to the end of the canal Compatible with supply oriented operation Inefficient with demand oriented operation
Control Logic Directly control gate position in order to control levels Two level control - Compute required gate discharges in order to control water levels - Manipulate gate openings to obtain the requested gate discharges
Why distributed control? Coordination between sub-systems is needed, i.e. the avoidance of upstream disturbance amplification in canals consisting of canal reaches in series The number of reaches and gates can be high - computational limitations for a centralized system Different section of the canal can be managed by different control centers and even by different organizations.
Possible approaches Manual Semi-manual Total Automation But underlying principle is the same
Possible approaches Manual Semi-manual Total Automation But underlying principle is the same
Software In any type of control, the heart of the system is the software that implements the chosen logic. Typical software components: - Network visualization - Network flow control - Scheduling - Delivery - Compliance - Tariff and invoicing - Historical Data
Network visualization Provides a visual, schematic representation of the entire irrigation network so that operators have an intuitive 360 degree, high and low-level feel of total network behavior.
Network visualization - On-screen visualization of network - Fast navigation through even complex networks - Ability to view total demand and downstream usage at any point in the network - Segment network into areas and groups for reporting, performance monitoring, user messaging or operational management
Network control Operation of the whole canal network is optimized in response to customer requirements. Constant flows to farmers are maintained while simultaneously eliminating spills at the end of the canals. By eliminating unnecessary spills, more water remains available in the dam or river for use at another time.
Automated Delivery Automates the scheduling of water deliveries to utilize the available capacity of the canal system Schedules the turnout to automatically open and close the gate at the planned time, day or night. Farmers requesting water online and receive confirmation of order
Historical data - Automatic data collection from field devices and software packages - Manual data entry with remote option via web browser/mobile device Interfaces with existing SCADA systems - Should support common industry standard data formats like WaterML - Should analyze multi-year trends - Report to external stakeholders
Standards - WaterML 2.0 is a standard information model for the representation of water observations data, with the intent of allowing the exchange of such data sets across information systems. - Through the use of existing (Open Geospatial standard (OGC), it aims at being an interoperable exchange format that may be re- used to address a range of exchange requirements.
Model Predictive control logic Based on Current demand/supply Predicted demand/supply
Risk Management Risk management can be applied to optimize the Irrigation Canal operation in order to consider process uncertainties. Uses risk metrics, forecasts the water level of reaches and evaluates cost and benefit.
