E-Metrics & E-Business Analytics Overview


E
-
M
e
t
r
i
c
s
a
n
d
E
-
B
u
s
i
n
e
s
s
A
n
a
l
y
t
i
c
s

W
e
b
U
s
a
g
e
M
i
n
i
n
g
&
E
-
B
u
s
i
n
e
s
s
A
n
a
l
y
t
i
c
s
2
i
The primary goal of e-business analytics is to understand and be
able to predict the behavior of online customers
i
Examples of questions we want to answer using the data
4
Where did visitors come from?
4
What do they do when they get to the site?
4
How happy are the visitors/customers?
4
What are the outcomes: conversions, repeat visits, loyalty?
4
What types of content attracts which types of customers?
4
Which customers are profitable?
4
How profitable are different products or product categories?
i
Where do data-driven answers to these question come from?
4
E-metrics – metrics/statistics that tell us something about online behavior of the
user on the site
4
Data mining – finding deeper patterns in the data and building models
W
e
b
U
s
a
g
e
M
i
n
i
n
g
&
E
-
B
u
s
i
n
e
s
s
A
n
a
l
y
t
i
c
s
4
Session Analysis
4
Static Aggregation and Statistics
4
OLAP
4
Data Mining
Different Levels of Analysis
3
S
e
s
s
i
o
n
A
n
a
l
y
s
i
s
i
Simplest form of analysis: examine individual or groups of
user sessions and/or e-commerce transactions
i
Advantages:
4
Gain insight into typical customer behaviors
4
Trace specific problems with the site
i
Drawbacks:
4
LOTS of data
4
Difficult to generalize
4
S
t
a
t
i
c
A
g
g
r
e
g
a
t
i
o
n
(
R
e
p
o
r
t
s
)
i
Most common form of analysis (e.g., Google Analytics,
WebTrends, etc.)
i
Data aggregated by predetermined units such as days or
sessions
i
Generally gives most “bang for the buck.”
i
Advantages:
4
Gives quick overview of how a site is being used.
4
Minimal disk space or processing power required.
i
Drawbacks:
4
No ability to “dig deeper” into the data.
5
S
t
a
t
i
c
A
g
g
r
e
g
a
t
i
o
n
(
R
e
p
o
r
t
s
)
6
i
Typical tools:
4
Google Analytics
4
Urchin
4
WebTrends
O
n
l
i
n
e
A
n
a
l
y
t
i
c
a
l
P
r
o
c
e
s
s
i
n
g
(
O
L
A
P
)
i
Allows changes to aggregation level for multiple dimensions
i
Generally associated with a Data Warehouse
i
Advantages & Drawbacks
4
Very flexible
4
Requires significantly more resources than static reporting.
7
D
a
t
a
M
i
n
i
n
g
:
G
o
i
n
g
d
e
e
p
e
r
Sequence
mining
Markov
chains
Association
rules
Clustering
Session
Clustering
Classification
Prediction of next event
Discovery of associated events
or application objects
Discovery of visitor groups with
common properties and
interests
Discovery of visitor groups with
common behaviour
Characterization of visitors with
respect to a set of predefined
classes
Anomaly/attack detection
H
o
w
D
a
t
a
M
i
n
i
n
g
i
s
U
s
e
d
-
E
x
a
m
p
l
e
s
i
Calibration of a Web server:
4
Prediction of the next page invocation over a group of concurrent Web
users under certain constraints
h
Sequence mining, Markov chains
4
Prefetching resources that are likely to be accessed next
i
Cross-selling of products:
4
Mapping of Web pages/objects to products
4
Discovery of associated products
h
Association rules, Sequence Mining
4
Placement of associated products on the same page
4
Determining which items or product to feature on specific pages
9
H
o
w
D
a
t
a
M
i
n
i
n
g
i
s
U
s
e
d
-
E
x
a
m
p
l
e
s
i
Sophisticated cross-selling and up-selling of products:
4
Mapping of pages/objects to products of different price groups
4
Identification of Customer Groups or Segments
h
Clustering, Classification
4
Discovery of associated products of the same/different price
categories
h
Association rules, Sequence Mining
4
Formulation of recommendations to the end-user
h
Suggestions on associated products
h
Suggestions based on the preferences of similar users
10
E
-
M
e
t
r
i
c
s
i
Collection of aggregate statistics and metrics necessary to
4
Understand visitor/customer behavior
4
Understand how visitors are using the site
4
Measure e-business outcomes such as conversion, loyalty, etc.
4
Monitor factors that prevent successful outcomes
i
Basic Types of E-Metrics (not necessarily mutually exclusive)
4
Site e-metrics
– metrics that tell us something about how the site as a whole or
specific components (pages, categories, tools, functions) are being used and
how to improve the site or its content
4
Customer e-metrics
– metrics that characterize the behavior of visitor or
visitor segments and measure the propensity of visitors convert
4
Basic business metrics – general metrics to measure how successfully overall
business objectives are being met (revenue, profitability, etc.).
11
12
E
-
M
e
t
r
i
c
s
C
o
m
m
o
n
l
y
U
s
e
d
b
y
I
n
d
u
s
t
r
y
B
a
s
i
c
S
i
t
e
M
e
t
r
i
c
s
•
Which site “referred”
them
–
Search engine
–
Affiliate site
–
Partner
–
Advertisement
–
Contribution to sales or
other desired outcome
•
Measures - allows the
evaluation of the
referrer
–
What percentage of all
referrals came from this
source?
–
Calculation of the cost of
acquisition of each
visitor
13
•
We can monitor
–
Which content is
accessed by users
–
When they visit
–
How long they stay
–
Whether interaction with
content leads to sales or
other desired outcome
•
Measures – eg.
–
Bounce rate: proportion
of visitors to a page who
leave immediately
–
Stickiness: how long a
visitor stays on the site,
and how many repeat
visits they make
–
Conversion rate: % of
visitors who perform a
desired action
B
a
s
i
c
S
i
t
e
M
e
t
r
i
c
s
14
K
e
y
M
e
a
s
u
r
e
s
N
e
e
d
e
d
t
o
C
o
m
p
u
t
e
A
g
g
r
e
g
a
t
e
S
i
t
e
E
-
M
e
t
r
i
c
s
15
16
M
o
r
e
o
n
B
a
s
i
c
S
i
t
e
M
e
t
r
i
c
s
i
Stickiness
4
measures site effectiveness in retaining visitors within a specified time period
4
related to duration and frequency of visit
where
This simplifies to:
17
M
o
r
e
o
n
B
a
s
i
c
S
i
t
e
M
e
t
r
i
c
s
i
Slipperiness
4
inverse of stickiness
4
used for portions of the site in which it low stickiness in desired (e.g., customer
service or online support)
i
Focus
4
measures visit behavior within specific sections of the site
18
S
h
o
p
p
i
n
g
P
i
p
e
l
i
n
e
A
n
a
l
y
s
i
s
i
Shopping pipeline modeled as state transition diagram
i
Sensitivity analysis of state transition probabilities
i
Promotion opportunities identified
i
E-metrics and ROI used to measure effectiveness
Overall goal:
•
Maximize probability
of reaching final state
•
Maximize expected
sales from each visit
cross-sell
promotions
up-sell
promotions
‘sticky’
states
‘slippery’
state, i.e.
1-click buy
19
M
e
t
r
i
c
s
f
o
r
E
-
C
u
s
t
o
m
e
r
L
i
f
e
C
y
c
l
e
i
Describe the milestones at which we:
4
target new visitors
4
acquire new visitors
4
convert them into registered/paying users
4
keep them as customers
4
create loyalty
20
E
l
e
m
e
n
t
s
o
f
E
-
C
u
s
t
o
m
e
r
L
i
f
e
C
y
c
l
e
i
Reach
4
targeting new potential visitors
4
can be measured as a percentage of the total market or based on other measures
of new unique users visiting the site
i
Acquisition
4
transformation of targeting to active interaction with the site
4
e.g., how many new users sessions have a referrer with a banner ad?
4
e.g., what percentage of targeted audience base is visiting the site?
i
Conversion
4
a conversion rate is the ratio of “completers” to total “starters” for any
predetermined activity that is more than one logical step in length
4
examples:
percentage of site visitors who perform a particular action such as
registering for a newsletter, subscribing to an RSS feed, or making a purchase
4
We can get more fine-grained measures:
micro-conversion rates
h
look-to-click rate; click-to-basket rate; basket-to-buy rate
21
E
l
e
m
e
n
t
s
o
f
E
-
C
u
s
t
o
m
e
r
L
i
f
e
C
y
c
l
e
i
Retention
4
difficult to measure and metrics may need to be time/domain dependent
4
usually measured in terms of visit/purchase frequency within a given time
period and in a given product/content category
4
time-based thresholds may need to be used to distinguish between retained
users and deactivated-reactivated users
i
Loyalty
4
loyalty is indicated by more than purchase/visit frequency; it also indicates
loyalty to the site or company as a whole
4
special referral or “bonus” campaigns may be used to determine loyal
customers who refer products or the site to others
4
in the absence of other information, combinations of measures such as
frequency, recency, and monetary value could be used to distinguish loyal
users/customers
22
E
l
e
m
e
n
t
s
o
f
E
-
C
u
s
t
o
m
e
r
L
i
f
e
C
y
c
l
e
I
n
t
e
r
r
u
p
t
i
o
n
s
i
n
t
h
e
L
i
f
e
C
y
c
l
e
i
Abandonment
4
measures the degree to which users may abandon partial transactions (e.g.,
shopping cart abandonment, etc.)
4
the goal is to measure the abandonment of the conversion process
4
micro-conversion ratios are useful in measuring this type of event
i
Attrition
4
applies to users/customers that have already been converted
4
usually measures the % of converted users who have ceased/reduced their
activity within the site in a given period of time
i
Churn
4
is measured based on attrition rates within a given time period (ratio of
attritions to total number of customers
4
goal is to measure “roll-overs’ in the customer life cycle (e.g., percentage
loss/gain in subscribed users in a month, etc.)
23
B
a
s
i
c
E
-
C
u
s
t
o
m
e
r
L
i
f
e
c
y
c
l
e
M
e
t
r
i
c
s
24
M
i
c
r
o
-
C
o
n
v
e
r
s
i
o
n
R
a
t
e
s
M
1
(
s
a
w
p
r
o
d
u
c
t
i
m
p
r
e
s
s
i
o
n
)
M
2
(
p
e
r
f
o
r
m
e
d
p
r
o
d
u
c
t
c
l
i
c
k
t
h
r
o
u
g
h
)
M
3
(
p
l
a
c
e
d
p
r
o
d
u
c
t
i
n
s
h
o
p
p
i
n
g
c
a
r
t
)
NM1
NC
NM2
NC
NM3
NC
25
M
i
c
r
o
-
C
o
n
v
e
r
s
i
o
n
R
a
t
e
s
P
M
1
(
s
a
w
p
r
o
d
u
c
t
i
m
p
r
e
s
s
i
o
n
)
M
2
(
p
e
r
f
o
r
m
e
d
p
r
o
d
u
c
t
c
l
i
c
k
t
h
r
o
u
g
h
)
M
3
(
p
l
a
c
e
d
p
r
o
d
u
c
t
i
n
s
h
o
p
p
i
n
g
c
a
r
t
)
M
4
=
C
(
m
a
d
e
p
u
r
c
h
a
s
e
)
NP
NC
NM1
NC
NM2
NC
NM3
NC
26
B
a
s
i
c
E
-
C
u
s
t
o
m
e
r
M
e
t
r
i
c
s
-
R
F
M
i
RFM (Recency, Frequency, Monetary Value)
4
each user/customer can be scored along 3 dimensions, each providing unique
insights into that customers behavior
4
Recency -
inverse of the time duration in which the user has been inactive
4
Frequency -
the ratio of visit/purchase frequency to specific time duration
4
Monetary Value -
total $ amount of purchases (or profitability) within a given time period
27
B
u
i
l
d
i
n
g
T
h
e
C
u
s
t
o
m
e
r
S
i
g
n
a
t
u
r
e
i
Building a customer signature is a significant effort, but well worth
the effort
i
A signature summarizes customer or visitor behavior across
hundreds of attributes, many which are specific to the site
i
Once a signature is built, it can be used to answer many questions
i
The mining algorithms will pick the most important attributes for
each question
i
Example attributes computed:
4
Total Visits and Sales
4
Revenue by Product Family
4
Revenue by Month
4
Customer State and Country
4
Recency, Frequency, Monetary (RFM)
4
Latitude/Longitude from the Customer’s Postal Code
E
-
M
e
t
r
i
c
s
a
n
d
E
-
B
u
s
i
n
e
s
s
A
n
a
l
y
t
i
c
s
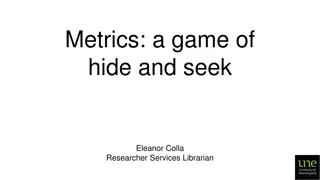
Web usage mining and e-business analytics play a crucial role in understanding and predicting online customer behavior. This involves answering important questions related to visitor origin, on-site activities, customer satisfaction, outcomes, content preferences, profitability analysis, and more. Different levels of analysis such as session analysis, static aggregation, and data mining are utilized to gain insights and make informed decisions. Tools like Google Analytics and WebTrends are commonly used for static aggregation reports. Online Analytical Processing (OLAP) allows for flexible changes in aggregation levels across multiple dimensions, but requires more resources compared to static reporting methods.

Download Presentation

Please find below an Image/Link to download the presentation.
The content on the website is provided AS IS for your information and personal use only. It may not be sold, licensed, or shared on other websites without obtaining consent from the author.If you encounter any issues during the download, it is possible that the publisher has removed the file from their server.
You are allowed to download the files provided on this website for personal or commercial use, subject to the condition that they are used lawfully. All files are the property of their respective owners.
The content on the website is provided AS IS for your information and personal use only. It may not be sold, licensed, or shared on other websites without obtaining consent from the author.
E N D
Presentation Transcript
E-Metrics and E-Business Analytics Bamshad Mobasher DePaul University
Web Usage Mining & E-Business Analytics The primary goal of e-business analytics is to understand and be able to predict the behavior of online customers Examples of questions we want to answer using the data Where did visitors come from? What do they do when they get to the site? How happy are the visitors/customers? What are the outcomes: conversions, repeat visits, loyalty? What types of content attracts which types of customers? Which customers are profitable? How profitable are different products or product categories? Where do data-driven answers to these question come from? E-metrics metrics/statistics that tell us something about online behavior of the user on the site Data mining finding deeper patterns in the data and building models 2
Web Usage Mining & E-Business Analytics Different Levels of Analysis Session Analysis Static Aggregation and Statistics OLAP Data Mining 3
Session Analysis Simplest form of analysis: examine individual or groups of user sessions and/or e-commerce transactions Advantages: Gain insight into typical customer behaviors Trace specific problems with the site Drawbacks: LOTS of data Difficult to generalize 4
Static Aggregation (Reports) Most common form of analysis (e.g., Google Analytics, WebTrends, etc.) Data aggregated by predetermined units such as days or sessions Generally gives most bang for the buck. Advantages: Gives quick overview of how a site is being used. Minimal disk space or processing power required. Drawbacks: No ability to dig deeper into the data. Page View Home Page Catalog Ordering Shopping Cart Number of Sessions 50,000 500 9000 Average View Count per Session 1.5 1.1 2.3 5
Static Aggregation (Reports) Typical tools: Google Analytics Urchin WebTrends 6
Online Analytical Processing (OLAP) Allows changes to aggregation level for multiple dimensions Generally associated with a Data Warehouse Advantages & Drawbacks Very flexible Requires significantly more resources than static reporting. Page View Kid's Stuff Products Number of Sessions 2,000 Average View Count per Session 5.9 Page View Kid's Stuff Products Electronics Educational Radio-Controlled Number of Sessions Average View Count per Session 63 93 2.3 2.5 7
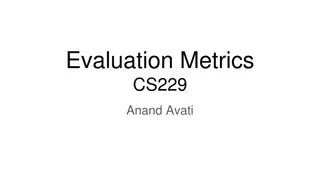
Data Mining: Going deeper Markov chains Prediction of next event Sequence mining Discovery of associated events or application objects Association rules Discovery of visitor groups with common properties and interests Clustering Session Clustering Discovery of visitor groups with common behaviour Characterization of visitors with respect to a set of predefined classes Classification Anomaly/attack detection
How Data Mining is Used - Examples Calibration of a Web server: Prediction of the next page invocation over a group of concurrent Web users under certain constraints Sequence mining, Markov chains Prefetching resources that are likely to be accessed next Cross-selling of products: Mapping of Web pages/objects to products Discovery of associated products Association rules, Sequence Mining Placement of associated products on the same page Determining which items or product to feature on specific pages 9
How Data Mining is Used - Examples Sophisticated cross-selling and up-selling of products: Mapping of pages/objects to products of different price groups Identification of Customer Groups or Segments Clustering, Classification Discovery of associated products of the same/different price categories Association rules, Sequence Mining Formulation of recommendations to the end-user Suggestions on associated products Suggestions based on the preferences of similar users 10
E-Metrics Collection of aggregate statistics and metrics necessary to Understand visitor/customer behavior Understand how visitors are using the site Measure e-business outcomes such as conversion, loyalty, etc. Monitor factors that prevent successful outcomes Basic Types of E-Metrics (not necessarily mutually exclusive) Site e-metrics metrics that tell us something about how the site as a whole or specific components (pages, categories, tools, functions) are being used and how to improve the site or its content Customer e-metrics metrics that characterize the behavior of visitor or visitor segments and measure the propensity of visitors convert Basic business metrics general metrics to measure how successfully overall business objectives are being met (revenue, profitability, etc.). 11
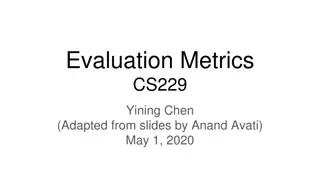
E-Metrics Commonly Used by Industry Number of customers 100% 95% Visits resulting in purchase Average order value 91% Number of registered users 88% Origin of visitors 86% Customer service response time 79% Purchases over the last six months 79% Number of repeat visitors 74% Revenue for repeat visitors 63% Origin of repeat visitors 63% New and repeat conversion rates 60% Customers in a loyalty program 47% 12
Basic Site Metrics Measures - allows the evaluation of the referrer What percentage of all referrals came from this source? Calculation of the cost of acquisition of each visitor Which site referred them Search engine Affiliate site Partner Advertisement Contribution to sales or other desired outcome 13
Basic Site Metrics We can monitor Which content is accessed by users When they visit How long they stay Whether interaction with content leads to sales or other desired outcome Measures eg. Bounce rate: proportion of visitors to a page who leave immediately Stickiness: how long a visitor stays on the site, and how many repeat visits they make Conversion rate: % of visitors who perform a desired action 14
Key Measures Needed to Compute Aggregate Site E-Metrics Measure Measure Definition How many users? (audience reach) IP+User-agent Cookie and/or Registration A series of one or more page impressions served to one user (gap of 30minutes=end of visit) File (or files) sent to a user as a result of a server request by that user Unique users How often? (frequency and recency metrics) Visit (user session) How many views? (volume metric) Page impression How many Ad views? A file (or files) sent to a user as an individual ad as a result of a server request by that user An ad impression clicked on by a valid user Ad impressions What do they do? Ad clicks? 15
More on Basic Site Metrics Stickiness measures site effectiveness in retaining visitors within a specified time period related to duration and frequency of visit Stickiness = Frequency x Duration x Total Site Reach where Frequency = (Visits in time period T) / (Unique users who visited in T) Duration = (Total View Time) / (Unique users who visited in T) Total Site Reach = (Unique users who visited in T) / (Total Unique Users) This simplifies to: Stickiness = (Total View Time) / (Total Unique Users) 16
More on Basic Site Metrics Slipperiness inverse of stickiness used for portions of the site in which it low stickiness in desired (e.g., customer service or online support) Focus measures visit behavior within specific sections of the site Focus = (Avg. no. of pages visited in section S) / (Total no. of pages in S) High Stickiness Low Stickiness Either consuming interest on the part of users, or users are stuck. Further investigation required. Either quick satisfaction or perhaps disinterest in this section. Further investigation required. Narrow Focus Attempting to locate the correct information. Enjoyable browsing indicates a site magnet area . Wide Focus 17
Shopping Pipeline Analysis sticky states Overall goal: Maximize probability of reaching final state Maximize expected sales from each visit Browse catalog Complete purchase Enter store Select items slippery state, i.e. 1-click buy cross-sell promotions up-sell promotions Shopping pipeline modeled as state transition diagram Sensitivity analysis of state transition probabilities Promotion opportunities identified E-metrics and ROI used to measure effectiveness 18
Metrics for E-Customer Life Cycle Describe the milestones at which we: target new visitors acquire new visitors convert them into registered/paying users keep them as customers create loyalty Loyalty 19
Elements of E-Customer Life Cycle Reach targeting new potential visitors can be measured as a percentage of the total market or based on other measures of new unique users visiting the site Acquisition transformation of targeting to active interaction with the site e.g., how many new users sessions have a referrer with a banner ad? e.g., what percentage of targeted audience base is visiting the site? Conversion a conversion rate is the ratio of completers to total starters for any predetermined activity that is more than one logical step in length examples: percentage of site visitors who perform a particular action such as registering for a newsletter, subscribing to an RSS feed, or making a purchase We can get more fine-grained measures: micro-conversion rates look-to-click rate; click-to-basket rate; basket-to-buy rate 20
Elements of E-Customer Life Cycle Retention difficult to measure and metrics may need to be time/domain dependent usually measured in terms of visit/purchase frequency within a given time period and in a given product/content category time-based thresholds may need to be used to distinguish between retained users and deactivated-reactivated users Loyalty loyalty is indicated by more than purchase/visit frequency; it also indicates loyalty to the site or company as a whole special referral or bonus campaigns may be used to determine loyal customers who refer products or the site to others in the absence of other information, combinations of measures such as frequency, recency, and monetary value could be used to distinguish loyal users/customers 21
Elements of E-Customer Life Cycle Interruptions in the Life Cycle Abandonment measures the degree to which users may abandon partial transactions (e.g., shopping cart abandonment, etc.) the goal is to measure the abandonment of the conversion process micro-conversion ratios are useful in measuring this type of event Attrition applies to users/customers that have already been converted usually measures the % of converted users who have ceased/reduced their activity within the site in a given period of time Churn is measured based on attrition rates within a given time period (ratio of attritions to total number of customers goal is to measure roll-overs in the customer life cycle (e.g., percentage loss/gain in subscribed users in a month, etc.) 22
Basic E-Customer Life cycle Metrics W(Target Market) NS S(Site Visitors) Note: Each of W, S, P, C and CR must be defined based on site characteristics and business objectives. P(Prospects / Active Investigators) NP NC C(Customers) CB(Abandon Cart) CR C1 CA (Repeat Customers) (one-time Customers) (Attrited Customers) 23
Micro-Conversion Rates M1 (saw product impression) NM1 NC M2(performed product click through) NM2 NC M3(placed product in shopping cart) NM3 NC 24
Micro-Conversion Rates P NP NC M1 (saw product impression) NM1 NC M2(performed product click through) NM2 NC M3(placed product in shopping cart) NM3 NC M4 = C(made purchase) 25
Basic E-Customer Metrics - RFM RFM (Recency, Frequency, Monetary Value) each user/customer can be scored along 3 dimensions, each providing unique insights into that customers behavior Recency - inverse of the time duration in which the user has been inactive Frequency - the ratio of visit/purchase frequency to specific time duration Monetary Value - total $ amount of purchases (or profitability) within a given time period Monetary Value 5 4 3 2 1 1 2 3 4 5 Frequency 26
Building The Customer Signature Building a customer signature is a significant effort, but well worth the effort A signature summarizes customer or visitor behavior across hundreds of attributes, many which are specific to the site Once a signature is built, it can be used to answer many questions The mining algorithms will pick the most important attributes for each question Example attributes computed: Total Visits and Sales Revenue by Product Family Revenue by Month Customer State and Country Recency, Frequency, Monetary (RFM) Latitude/Longitude from the Customer s Postal Code 27
E-Metrics and E-Business Analytics Bamshad Mobasher DePaul University


")
")
")