Disadvantage in Road Safety Research
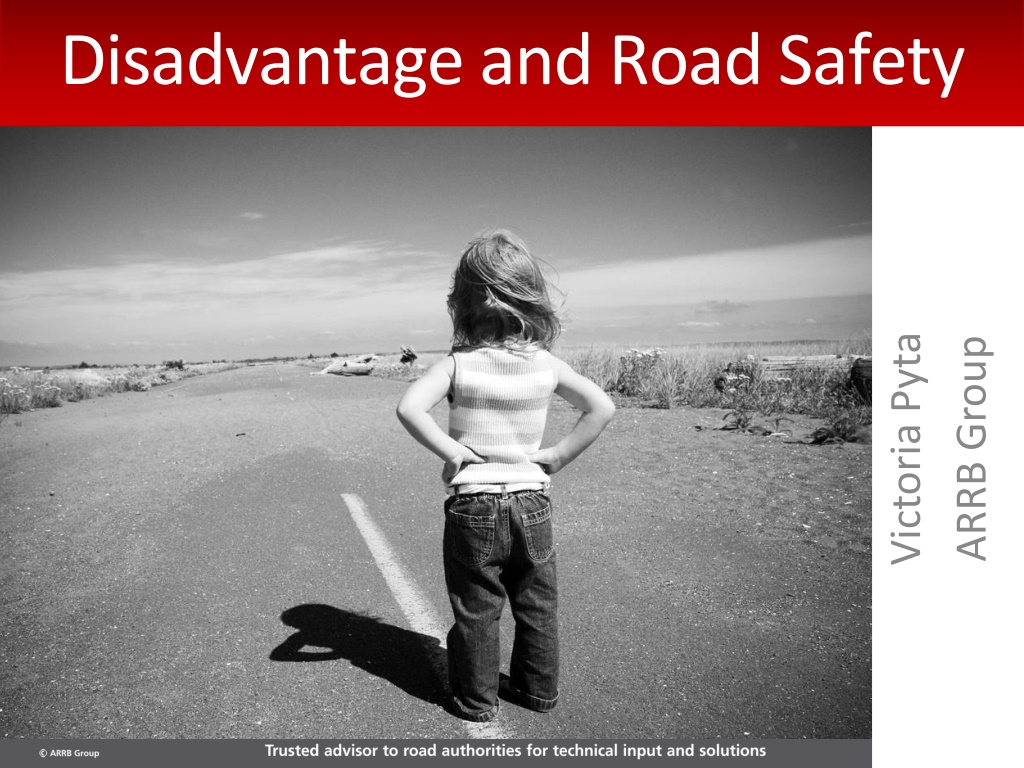
Victoria Pyta
ARRB Group
Disadvantage and Road Safety
Contents
PROJECT OVERVIEW
•
Background
•
Objectives
•
Definition of disadvantage
Background
Austroads project SS1761 (2012 – 2015)
–
Literature review
–
Data analysis and modelling
–
Consultation
Project Team:
–
Project Technical Leader: Victoria Pyta (ARRB)
–
Project Manager: Anita Baruah (VicRoads)
–
Quality Manager: Dr Peter Cairney (ARRB)
Project Objectives
What is disadvantage?
What is disadvantage?
–
Low income relative to others and/or expenditure
on necessities
–
Barriers to education, social opportunities or work
–
A ‘relative’ and ‘multi-dimensional’ concept
How is disadvantage related to road safety?
–
Socio-economic disadvantage is associated with
higher injury rates due to transport-related
injuries.
LITERATURE REVIEW
•
Effects of disadvantage on road trauma
•
Factors that are associated with both disadvantage and road trauma
•
Interventions
Victoria, Australia
•
Victorian Injury
Surveillance
Unit
•
Transport
injuries
represent 14%
of all injuries in
the hospital
admissions data
•
Persons with
greatest risk
come from the
2
nd
and 3
rd
quintiles
New South Wales, Australia
Remoteness and low SES associated with
increased risk of death among young drivers
Rural fatalities
Higher posted speed
limits
Fatigue
Drink-driving
Seatbelt non-use
Low SES fatalities
Higher posted speed
limits
Fatigue
Driving an older
vehicle
Indigenous populations of
Australia and New Zealand
Australia
Drink driving
Unlicensed driving
Remoteness amplifies
problems and accounts
for much of the
disparity
New Zealand
Among most severely disadvantaged
High road fatality rate compared to non-indigenous populations
Cultural and language differences
Over-representation is
particularly strong
among 15-24 year olds
Disparities persist after
accounting for
differences in SES
International
Many studies (UK, Europe, Israel, USA)
Disadvantage associated with higher risk,
particularly for
child pedestrians
Concomitant factors:
–
Environmental,
e.g. location (especially remoteness),
exposure
–
Behavioural factors
, e.g. unlicensed driving, drug and
alcohol use
–
Socio-cultural factors
, i.e. peer group and culture
–
Personal factors
, e.g. health, self-efficacy
Existing interventions
Low income earners
(registration discounts and
discounts on drink drive programs)
Indigenous communities
(wide range)
CALD communities
(translation, education and
awareness raising, licensing assistance)
Young drivers
(supervised practice, first car safety)
Children
(proper restraint use and early childhood road
safety education)
Engineering treatments
Enforcement and diversionary programs
Partnerships and community engagement
DATA ANALYSIS
•
Data sources
•
Results so far (exploratory descriptive analysis)
•
Next steps, methods and data sources
Data sources (Australia)
Crash data with postcode of crash involved
persons
–
Vic, NSW, SA
–
NZ (needs to be geocoded)
SES data
–
ABS Index of Relative Social Disadvantage (IRSD)
Remoteness data
–
ABS remoteness index
Potential for inclusion of travel survey data
–
e.g. ABS Survey of Motor Vehicle Use (SMVU)
Index of Relative Social Disadvantage
(Australia)
Takes into account:
–
Income
–
Household occupancy
–
Vehicle ownership
–
Illness and disability
–
% of residents speaking LOTE
–
% of residents of indigenous origin
–
Etc.
Preliminary results
(drivers and riders, Victoria)
Preliminary results
(drivers and riders, NSW)
Preliminary results
(drivers and riders, SA)
South Australia
(All road users, 10 years)
YEARS 2 AND 3
•
Looking forward
Remainder of 2013 – Modelling
Develop
model for crash risk
associated with
SES that takes into account:
–
Demographic profile of area
–
Remoteness
–
Environmental factors (e.g. speed limits)
–
Individual demographic factors (age, gender etc.)
–
Behavioural factors (e.g. restraint use)
–
Other explanatory factors (e.g. vehicle age)
2014/15
detailed
consultation
regarding the operation
of programs for disadvantaged groups or
locations
develop
recommendations
for actions to
address these issues
Acknowledgements
victoria.pyta@arrb.com.au
+61 3 9881 1640
Data providers in road agencies
SS1761 Project Team:
–
Dr Peter Cairney, Principal Behavioural Scientist
(ARRB)
–
Anita Baruah, Senior Policy Analyst, Road Safety and
Network Access (VicRoads)
Project steering committee
Supervisor
–
Dr Lyndon Walker, Swinburne University
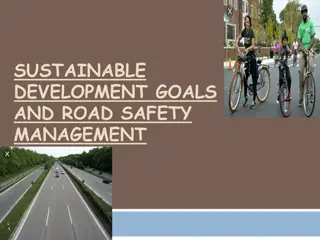
Investigating the impact of socio-economic disadvantage on road safety, focusing on identifying disparities in crash involvement and severity among individuals from different areas. The project aims to provide evidence-based strategies to address the identified issues. Factors associated with disadvantage and road trauma are explored through literature review and data analysis, shedding light on the relationship between low income, barriers to education, and safety on the roads.

Download Presentation

Please find below an Image/Link to download the presentation.
The content on the website is provided AS IS for your information and personal use only. It may not be sold, licensed, or shared on other websites without obtaining consent from the author.If you encounter any issues during the download, it is possible that the publisher has removed the file from their server.
You are allowed to download the files provided on this website for personal or commercial use, subject to the condition that they are used lawfully. All files are the property of their respective owners.
The content on the website is provided AS IS for your information and personal use only. It may not be sold, licensed, or shared on other websites without obtaining consent from the author.
E N D
Presentation Transcript
Disadvantage and Road Safety Victoria Pyta ARRB Group
Contents About this project Overview of literature review Preliminary findings Next steps
Background Objectives Definition of disadvantage PROJECT OVERVIEW
Background Austroads project SS1761 (2012 2015) Literature review Data analysis and modelling Consultation Project Team: Project Technical Leader: Victoria Pyta (ARRB) Project Manager: Anita Baruah (VicRoads) Quality Manager: Dr Peter Cairney (ARRB)
Project Objectives 1. Determine how the incidence, severity, nature and location of crash involvement varies between persons from more versus less disadvantaged areas. 2. Gain an understanding of how road environment, vehicle and behavioural factors are related to crash likelihood and severity outcomes among persons from disadvantaged areas. 3. Recommend evidence-based strategies for addressing the issues that are identified through this process.
What is disadvantage? What is disadvantage? Low income relative to others and/or expenditure on necessities Barriers to education, social opportunities or work A relative and multi-dimensional concept How is disadvantage related to road safety? Socio-economic disadvantage is associated with higher injury rates due to transport-related injuries.
Effects of disadvantage on road trauma Factors that are associated with both disadvantage and road trauma Interventions LITERATURE REVIEW
Victoria, Australia Victorian Injury Surveillance Unit Transport injuries represent 14% of all injuries in the hospital admissions data Persons with greatest risk come from the 2nd and 3rd quintiles 1.50 1.45 1.40 1.35 Incidence Rate Ratio 1.30 1.25 1.20 1.15 1.10 1.05 1.00 1st 2nd 3rd 4th 5th (ref) SES quintile LGA ranked by Index of Relative Social Disadvantage (IRSD) Persons assigned to LGA of residence Victorian hospital data (2005 to 2007)
New South Wales, Australia Remoteness and low SES associated with increased risk of death among young drivers Rural fatalities Higher posted speed limits Fatigue Drink-driving Seatbelt non-use Low SES fatalities Higher posted speed limits Fatigue Driving an older vehicle
Indigenous populations of Australia and New Zealand Among most severely disadvantaged High road fatality rate compared to non-indigenous populations Cultural and language differences Australia Drink driving Unlicensed driving Remoteness amplifies problems and accounts for much of the disparity New Zealand Over-representation is particularly strong among 15-24 year olds Disparities persist after accounting for differences in SES
International Many studies (UK, Europe, Israel, USA) Disadvantage associated with higher risk, particularly for child pedestrians Concomitant factors: Environmental, e.g. location (especially remoteness), exposure Behavioural factors, e.g. unlicensed driving, drug and alcohol use Socio-cultural factors, i.e. peer group and culture Personal factors, e.g. health, self-efficacy
Existing interventions Low income earners (registration discounts and discounts on drink drive programs) Indigenous communities (wide range) CALD communities (translation, education and awareness raising, licensing assistance) Young drivers (supervised practice, first car safety) Children (proper restraint use and early childhood road safety education) Engineering treatments Enforcement and diversionary programs Partnerships and community engagement
Data sources Results so far (exploratory descriptive analysis) Next steps, methods and data sources DATA ANALYSIS
Data sources (Australia) Crash data with postcode of crash involved persons Vic, NSW, SA NZ (needs to be geocoded) SES data ABS Index of Relative Social Disadvantage (IRSD) Remoteness data ABS remoteness index Potential for inclusion of travel survey data e.g. ABS Survey of Motor Vehicle Use (SMVU)
Index of Relative Social Disadvantage (Australia) Takes into account: Income Household occupancy Vehicle ownership Illness and disability % of residents speaking LOTE % of residents of indigenous origin Etc.
Preliminary results (drivers and riders, Victoria) 140.0 Fatalities and serious injuries per 100 000 120.0 100.0 adult population 80.0 60.0 Major Cities Inner Regional 40.0 20.0 0.0 Q1 (most disad.) Q2 Q3 Q4 Q5 (least disad.) IRSD quintile
Preliminary results (drivers and riders, NSW) 450.0 400.0 Fatalities and injuries per 350.0 100 000 population 300.0 250.0 Major Cities 200.0 Inner Regional 150.0 100.0 Outer, rural and remote 50.0 0.0 Q1 (most disad.) Q2 Q3 Q4 Q5 (least disad.) IRSD quintile
Preliminary results (drivers and riders, SA) 160.0 Fatalities and serious injuries per 140.0 100 000 population 120.0 Major Cities 100.0 Inner Regional 80.0 Outer, rural and remote 60.0 40.0 20.0 0.0 Q1 (most disad.) Q2 Q3 Q4 Q5 (least disad.) IRSD quintile
South Australia (All road users, 10 years) Number of persons Rate per 100,000 population IRSD Quintile Population (2006) Seriously Injured Seriously Injured Total Killed Total Killed 22.2 145.8 168.0 Q1 321 177 713 4 684 5 397 17.4 135.6 153.0 Q2 299 664 520 4 064 4 584 18.4 129.7 148.1 Q3 269 246 496 3 492 3 988 14.4 120.4 134.7 Q4 298 705 429 3 595 4 024 11.8 105.9 117.7 Q5 320 437 378 3 395 3 773 16.8 127.4 144.2 TOTAL 1 509 229 2 536 19 230 21 766
Remainder of 2013 Modelling Develop model for crash risk associated with SES that takes into account: Demographic profile of area Remoteness Environmental factors (e.g. speed limits) Individual demographic factors (age, gender etc.) Behavioural factors (e.g. restraint use) Other explanatory factors (e.g. vehicle age)
2014/15 detailed consultation regarding the operation of programs for disadvantaged groups or locations develop recommendations for actions to address these issues
Acknowledgements Data providers in road agencies SS1761 Project Team: Dr Peter Cairney, Principal Behavioural Scientist (ARRB) Anita Baruah, Senior Policy Analyst, Road Safety and Network Access (VicRoads) Project steering committee Supervisor Dr Lyndon Walker, Swinburne University victoria.pyta@arrb.com.au +61 3 9881 1640


")