Digital Marketing: Strategies for Success


Courtesy of CRC Press/Taylor & Francis Group
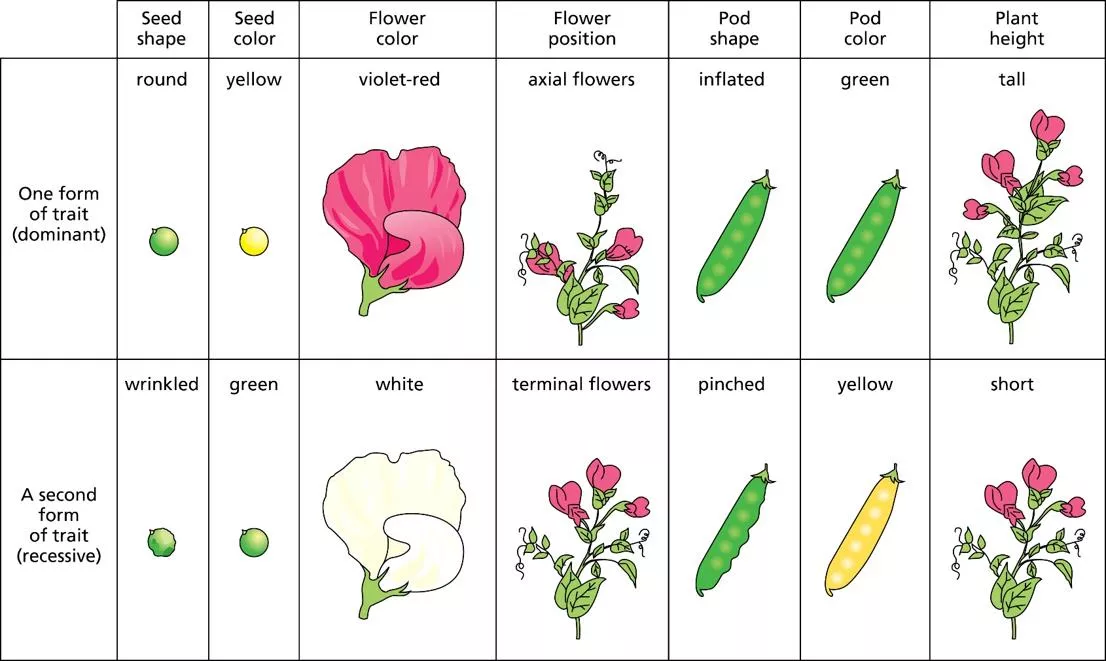
Figure 2.1 The seven traits studied by Mendel in peas.
Courtesy of CRC Press/Taylor & Francis Group
Figure 2.2 The structure of a pea flower.
A more complete view of the sexual reproductive structures of flowering plants is shown in Figure 6.13.
Courtesy of CRC Press/Taylor & Francis Group
Figure 2.3 One of Mendel’s experiments
with peas differing in a single trait.
Courtesy of CRC Press/Taylor & Francis Group
Figure 2.4 One of Mendel’s
experiments with peas
differing in two traits.
Courtesy of CRC Press/Taylor & Francis Group
Figure 2.5 (A) Structure of a nucleated cell. (B) Individual chromosomes can only be seen in cells undergoing division (marked with red asterisks).
The images shown are for onion root
tip cells.
Courtesy of CRC Press/Taylor & Francis Group
Figure 2.6 Comparison of (A) a single chromosome, (B) a duplicated chromosome, and (C) a homologous pair of duplicated chromosomes.
Courtesy of CRC Press/Taylor & Francis Group
Figure 2.7 Comparison of chromosome numbers in (A) a gamete (haploid) (N = 2); (B) a somatic (diploid) cell (2N = 4) from a diploid species that has its DNA divided between two
distinct chromosomes.
Courtesy of CRC Press/Taylor & Francis Group
Figure 2.8 Asexual reproduction via mitosis.
Many single-celled organisms, like the budding yeast
Saccharomyces cerevisiae
.
(A)
and even some multicellular organisms, like hydra
(B)
reproduce asexually via mitotic cell division to produce a new, genetically identical individual (clone) that separates from the parent.
Courtesy of CRC Press/Taylor & Francis Group
Figure 2.9 Mitosis.
The cell divides in such a way that each of the two offspring cells contains the same number of paired chromosomes as the parent cell did. The drawings show a cell like that
in Figure 2.6, with a diploid number of 2N = 4 chromosomes (two pairs). The photographs are fluorescent images that show both chromosomes and spindle fibers.
(Continued)
Courtesy of CRC Press/Taylor & Francis Group
Figure 2.10 Meiosis.
A cell with a diploid number of
chromosomes (2N = 4 in this example) divides twice
to produce four haploid gametes (here with two
chromosomes each).
Courtesy of CRC Press/Taylor & Francis Group
Figure 2.11 Sexual life cycles.
In sexual reproduction, haploid gametes join by fertilization to form a new diploid individual with one of each pair of homologous chromosomes coming from
each parent. In multicelled organisms the diploid zygote divides by mitosis to form the adult organism. Each of the somatic (body) cells contains a set of chromosomes the same as that in the
zygote. In a male organism, meiosis produces sperm, as shown. In a female organism, meiosis produces eggs.
Courtesy of CRC Press/Taylor & Francis Group
Figure 2.12 A cross between pure-line
corn plants having different alleles for
two linked genes located on the same
chromosome.
Courtesy of CRC Press/Taylor & Francis Group
Figure 2.13. Linkage map of chromosome III in the fruit fly
Drosophila melanogaster
, showing just a few of the many
genes known.
Genes for recessive traits are in lowercase; genes
for dominant traits are capitalized. Distances along the chromosome
are in units called “centimorgans”; a distance of one centimorgan
corresponds to a 1% probability of a crossover between closely
linked genes.
Courtesy of CRC Press/Taylor & Francis Group
Figure 2.14 Griffith’s experiment
demonstrating hereditary
transformation in bacteria.
Courtesy of CRC Press/Taylor & Francis Group
Figure 2.15 The Hershey–
Chase experiment.
This
experiment confirmed DNA
as the genetic material.
Courtesy of CRC Press/Taylor & Francis Group
Figure 2.16 The nucleotides of DNA.
Courtesy of CRC Press/Taylor & Francis Group
Figure 2.17 The three-dimensional structure of DNA as determined by the technique of X-ray crystallography.
Courtesy of CRC Press/Taylor & Francis Group
Figure 2.18 DNA replication.
The two strands run in opposite directions, as denoted by the arrowheads on the orange (old) backbones. The direction of synthesis is indicated by the
arrowheads on the red (new) backbones. Note that either strand contains all the information needed to synthesize the other (complementary) strand.
Explore the fundamentals of digital marketing, including key concepts, strategies, and tools for success in the dynamic online landscape. Learn how to leverage digital channels effectively to reach and engage with target audiences, optimize campaigns, and measure performance for continuous improvement.

Uploaded on Sep 13, 2024 | 0 Views
Download Presentation

Please find below an Image/Link to download the presentation.
The content on the website is provided AS IS for your information and personal use only. It may not be sold, licensed, or shared on other websites without obtaining consent from the author.If you encounter any issues during the download, it is possible that the publisher has removed the file from their server.
You are allowed to download the files provided on this website for personal or commercial use, subject to the condition that they are used lawfully. All files are the property of their respective owners.
The content on the website is provided AS IS for your information and personal use only. It may not be sold, licensed, or shared on other websites without obtaining consent from the author.
E N D