Descriptive Statistics
Descriptive statistics provide a quantitative summary of data, including measures of central tendency (mean, median, mode) and variability (range, standard deviation, quartiles). Explore concepts like median, quartiles, and the five-number summary for better data insight.

Download Presentation

Please find below an Image/Link to download the presentation.
The content on the website is provided AS IS for your information and personal use only. It may not be sold, licensed, or shared on other websites without obtaining consent from the author.If you encounter any issues during the download, it is possible that the publisher has removed the file from their server.
You are allowed to download the files provided on this website for personal or commercial use, subject to the condition that they are used lawfully. All files are the property of their respective owners.
The content on the website is provided AS IS for your information and personal use only. It may not be sold, licensed, or shared on other websites without obtaining consent from the author.
E N D
Presentation Transcript
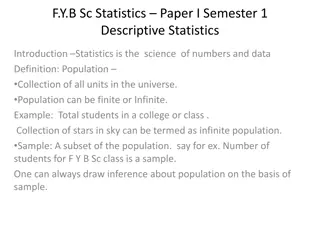
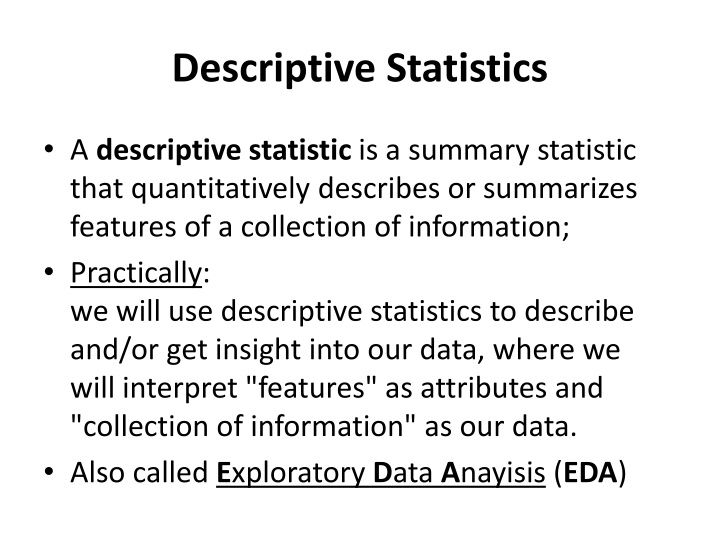
Descriptive Statistics A descriptive statistic is a summary statistic that quantitatively describes or summarizes features of a collection of information; Practically: we will use descriptive statistics to describe and/or get insight into our data, where we will interpret "features" as attributes and "collection of information" as our data. Also called Exploratory Data Anayisis (EDA)
Some of the Descriptive Statistics Measures of central tendency: mean (or average), median (or middle element), mode (or most frequent value). Measures of variability or dispersion: range (minimum, maximum), standard deviation (variance), quartiles (percentiles)
Min, Max, Avg, Median and Mode 1 8 1 3 2 8 8 5 4 Minimum: 1 Maximum: 8 Average (or mean): 4.44 Median: ? Mode: 8 1 1 2 3 4 5 8 8 8 1 1 2 3 4 5 8 8 8 9
Brief Review of Median A data set is any finite set of real numbers. A data set is in increasing order if the numbers in the data set are arranged from the least value to greatest value with the least value on the left and the greatest value on the right. The median of a data set is the number that, when the set is put into increasing order, divides the data into two equal parts. If a data set has an odd number of data points, then the median is the middle data value (when the data is in increasing order). If a data set has an even number of data points, then the median is the mean of the two middle data values (when the data is in increasing order).
First Quartile and Third Quartile The lower half of a data set is the set of all values that are to the left of the median value when the data has been put into increasing order. The upper half of a data set is the set of all values that are to the right of the median value when the data has been put into increasing order. The first quartile, denoted by Q1, is the median of the lower half of the data set. This means that about 25% of the numbers in the data set lie below Q1and about 75% lie above Q1. The third quartile, denoted by Q3, is the median of the upper half of the data set. This means that about 75% of the numbers in the data set lie below Q3and about 25% lie above Q3.
Five-Number Summary Definition: The five-number summary of a data set consists of the five numbers determined by computing the minimum, Q1, median, Q3, and maximum of the data set. The minimum value of a data set is the least value in the set. The maximum value of a data set is the greatest value in the set. The range of a data set is the distance between the maximum and minimum value. To compute the range of a data set, we subtract the minimum from the maximum: range = maximum minimum. The interquartile range of a data set is the distance between the two quartiles. Interquartile range = Q3 Q1.
Calculating percentiles example 1 1 2 3 4 5 8 8 8 1 1 2 3 4 5 8 8 8 (2-1) x 0. 5 = 0.5 25th percentile: 1 + 0.5 = 1.5 1 1 2 3 4 5 8 8 8 (8-8) x 0.5 = 0 75th percentile: 8 + 0 = 8
Calculating DS DIY 0 1 2 3 4 5 5 6 8 9 0 1 2 3 4 5 7 8 Minimum: ? Maximum: ? Mean: ? Median: ? Mode: ? 25th percentile: ? 75th percentile: ?
Box(-and-Whiskers) Plot Using the equal interval scale, we draw a rectangular box with one end at Q1and the other end at Q3. And then we draw a vertical segment at the median value. Finally, we draw two horizontal segments on each side of the box, one down to the minimum value and one up to the maximum value, (these segments are called the "whiskers"). Example 1: Draw a box-and-whisker plot for the data set {3, 7, 8, 5, 12, 14, 21, 13, 18}.


 Plot")
 Plot")
 Plot")
 Plot")