Density-Based Clustering Algorithms and DBSCAN Overview
Learn about density-based clustering algorithms utilizing density estimation techniques like DENCLUE and DBSCAN. Understand the concept of core, border, and noise points in DBSCAN for efficient clustering. Stay informed about upcoming tasks and lectures related to hierarchical clustering and clustering evaluation.

Download Presentation

Please find below an Image/Link to download the presentation.
The content on the website is provided AS IS for your information and personal use only. It may not be sold, licensed, or shared on other websites without obtaining consent from the author. If you encounter any issues during the download, it is possible that the publisher has removed the file from their server.
You are allowed to download the files provided on this website for personal or commercial use, subject to the condition that they are used lawfully. All files are the property of their respective owners.
The content on the website is provided AS IS for your information and personal use only. It may not be sold, licensed, or shared on other websites without obtaining consent from the author.
E N D
Presentation Transcript
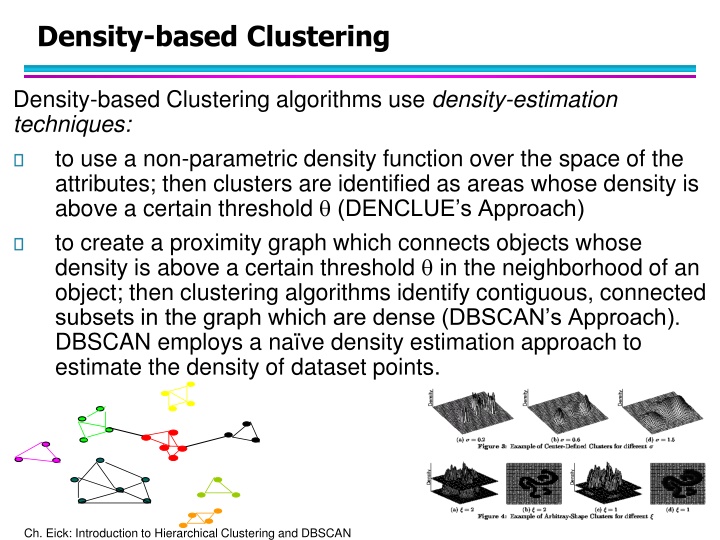
Density-based Clustering Density-based Clustering algorithms use density-estimation techniques: to use a non-parametric density function over the space of the attributes; then clusters are identified as areas whose density is above a certain threshold (DENCLUE s Approach) to create a proximity graph which connects objects whose density is above a certain threshold in the neighborhood of an object; then clustering algorithms identify contiguous, connected subsets in the graph which are dense (DBSCAN s Approach). DBSCAN employs a na ve density estimation approach to estimate the density of dataset points. Ch. Eick: Introduction to Hierarchical Clustering and DBSCAN
COSC 6335 Sept. 26, 2023 Dr. Eick will have no office hour on Sept. 26 and Oct. 3; however, a makeup office hour has been scheduled for We., Sept. 27, 2-3p! Task2 is due on October 7 (you have 7 more days). Task 3 is a 1 month group task (groups of 3 students) and you will receive an e-mail by Mahin on October 3 about setting up groups, and the final group compositions will be announced in the lecture on October 5! We also expect that the specification of Task3 will be posted on the course website on October 5. Task5 will center on clustering and maybe outlier detection. Task3 will be due on November 6! Today s topics: 1. DBSCAN 2. DENCLUE (brief; will be continued on October 12); 2 slides NPDE 3. Group E GHC Presentation 4. Brief Discussion of Task2 5. Cluster Evaluation and Validation Ch. Eick: Introduction to Hierarchical Clustering and DBSCAN
More on Clustering 1. Density-based Clustering will be discussed later 1. DBSCAN 2. DENCLUE (overview in this lecture and paper walk through on Oct. 12, 2023 lead by group H) 2. Hierarchical Clustering to be discussed on Sept. 19, 2023 Ch. Eick: Introduction to Hierarchical Clustering and DBSCAN
DBSCAN (http://www2.cs.uh.edu/~ceick/7363/Papers/dbscan.pdf ) DBSCAN is a density-based algorithm. Density = number of points within a specified radius (Eps) Input parameter: MinPts and Eps A point is a core point if it has more than a specified number of points (MinPts) within Eps These are points that are at the interior of a cluster A border point has fewer than MinPts within Eps, but is in the neighborhood of a core point A noise point is any point that is not a core point or a border point. Ch. Eick: Introduction to Hierarchical Clustering and DBSCAN
DBSCAN: Core, Border, and Noise Points MinPts = 7 Ch. Eick: Introduction to Hierarchical Clustering and DBSCAN
DBSCAN: Core, Border, and Noise Points Remark: Noise and border points have no outgoing edges in the assumed graph. Moreover, if there is an edge from a to b then b is directly density reachable from a! Ch. Eick: Introduction to Hierarchical Clustering and DBSCAN
DBSCAN Algorithm (simplified view for teaching) Create a directed graph whose nodes are the points to be clustered For each core-point c create an edge from c to every point p in the -neighborhood of c Set N to the nodes of the graph; If N does not contain any core points terminate Pick a core point c in N Let X be the set of nodes that can be reached from c by going forward; 1. create a cluster containing X {c} 2. N=N/(X {c}) Continue with step 4 Remarks: points that are not assigned to any cluster are outliers; http://www2.cs.uh.edu/~ceick/7363/Papers/dbscan.pdf gives a more efficient implementation by performing steps 2 and 6 in parallel 1. 2. 3. 4. 5. 6. 7. Ch. Eick: Introduction to Hierarchical Clustering and DBSCAN
DBSCAN: Core, Border and Noise Points Original Points Point types: core, border and noise Eps = 10, MinPts = 4 Ch. Eick: Introduction to Hierarchical Clustering and DBSCAN
When DBSCAN Works Well Original Points Clusters Resistant to Noise Supports Outliers Can handle clusters of different shapes and sizes Ch. Eick: Introduction to Hierarchical Clustering and DBSCAN
When DBSCAN Does NOT Work Well (MinPts=4, Eps=9.75). Original Points Problems with Varying densities High-dimensional data (MinPts=4, Eps=9.12) Ch. Eick: Introduction to Hierarchical Clustering and DBSCAN
DBSCAN in R dbscan(iris[3:4], 0.15, 3, showplot=1) dbscan Pts=150 MinPts=3 eps=0.15 0 1 2 3 4 5 6 border 20 2 5 0 3 2 1 seed 0 46 54 3 9 1 4 total 20 48 59 3 12 3 5 dbscan.r (demo) http://www.inside-r.org/node/59838 Ch. Eick: Introduction to Hierarchical Clustering and DBSCAN
DBSCANA Second Introduction Two parameters: Eps: Maximum radius of the neighbourhood MinPts: Minimum number of points in an Eps- neighbourhood of that point NEps(p): Directly density-reachable: A point p is directly density- reachable from a point q wrt. Eps, MinPts if {q belongs to D | dist(p,q) <= Eps} 1) p belongs to NEps(q) 2) core point condition: p MinPts = 5 Eps = 1 cm q |NEps (q)| >= MinPts 12 Ch. Eick: Introduction to Hierarchical Clustering and DBSCAN
Density-Based Clustering: Background (II) Density-reachable: A point p is density-reachable from a point q wrt. Eps, MinPts if there is a chain of points p1, , pn, p1 = q, pn = p such that pi+1 is directly density-reachable from pi p p1 q Density-connected A point p is density-connected to a point q wrt. Eps, MinPts if there is a point o such that both, p and q are density-reachable from o wrt. Eps and MinPts. p q o Remark: All pairs of points belonging to the same cluster a density connected 13 Ch. Eick: Introduction to Hierarchical Clustering and DBSCAN
DBSCAN: Density Based Spatial Clustering of Applications with Noise Relies on a density-based notion of cluster: A cluster is defined as a maximal set of density-connected points Capable to discovers clusters of arbitrary shape in spatial datasets with noise Not density reachable from core point Outlier Density reachable from core point Border Eps = 1cm Core MinPts = 5 14 Ch. Eick: Introduction to Hierarchical Clustering and DBSCAN
DBSCAN: The Algorithm 1. Arbitrary select a point p 2. Retrieve all points density-reachable from p wrt Eps and MinPts. 3. If p is a core point, a cluster is formed. 4. If p ia not a core point, no points are density-reachable from p and DBSCAN visits the next point of the database. 5. Continue the process until all of the points have been processed. Remark: Some bookkeeping is needed to make sure that only points that have not been assigned to a cluster yet, will be used in step 2. 15 Ch. Eick: Introduction to Hierarchical Clustering and DBSCAN
DBSCAN Questions from Previous Exams Assume you have two core points a and b, and a is density reachable from b, and b is density reachable from a; what will happen to a and b when DBSCAN clusters the data? [2] Assume we have a border point a that is within the radius of two core points b and c that are not density connected. What happens with this border point? Create an example dataset which matches this situation! Assume you run dbscan(iris[3:4], 0.15, 3) in R and obtain. 0 1 2 3 4 5 6 border 20 2 5 0 3 2 1 seed 0 46 54 3 9 1 4 total 20 48 59 3 12 3 5 What does the displayed result mean with respect to number of clusters, outliers, border points and core points? Now you run DBSCAM, increasing MinPoints to 5: dbscan(iris[3:4], 0.15, 5). How do you expect the clustering results to change? Next, we run DBSCAN changing epsilon to 0.25; how do the results change? [6] 1. 2. 3. Ch. Eick: Introduction to Hierarchical Clustering and DBSCAN
DBSCAN: Determining EPS and MinPts Idea is that for points in a cluster, their kth nearest neighbors are at roughly the same distance Noise points have the kth nearest neighbor at farther distance So, plot sorted distance of every point to its kth nearest neighbor Run DBSCAN for Minp=4 and =5 More on that in Task8 of ProblemSet3! Non-Core-points Core-points Not now! More discussion on this topic in the lecture on Oct. 14 which discusses Task3! Ch. Eick: Introduction to Hierarchical Clustering and DBSCAN
2. DENCLUE: Clustering using density functions DENsity-based CLUstEring by Hinneburg & Keim (KDD 98) Paper: http://www2.cs.uh.edu/~ceick/DM/Denclue2.pdf Slides Morteza Morteza H. Chehreghani Chehreghani from Sharif University: http://www2.cs.uh.edu/~ceick/DM/DENCLUE.pdf Randomized Hill Climbing slides (not relevant): http://www2.cs.uh.edu/~ceick/DM/RHC.pptx 18 Ch. Eick: Introduction to Hierarchical Clustering and DBSCAN
2023 DENCLUE Teaching Plan Source code of DENCLUE?? Everybody reads the DENCLUE 2.0 paper before Oct. 10, 2:30p. Tuesday, October 10: GHC Group H will lead a discussion (at most 25 minutes) of DENCLUE centering on producing initial answers to the following questions: What is a density attractor and how are density attractors computed by DENCLUE? What is a cluster in DENCLUE? How are clusters formed by DENCLUE? What is a path in DENCLUE? How are paths computed in DENCLUE? What algorithm is used to determine which clusters are merged? DENCLUE places a (hyper)grid on the top of the dataset Why?? How does DENCLUE s hill climbing procedure work? How was it enhanced in DENCLUE 2.0 in comparison of its older version? What objects in the dataset does DENCLUE classify as outliers? Report anything else you found interesting a. b. c. d. e. f. g. Remark: Dr. Eick will only listen, and maybe make some comments after the discussion. Ch. Eick: Introduction to Hierarchical Clustering and DBSCAN
Density-based Clustering: Pros and Cons +: can (potentially) discover clusters of arbitrary shape +: not sensitive to outliers and supports outlier detection +: can handle noise + : medium algorithm complexities O(n**2), O(n*log(n) : finding good density estimation parameters is frequently difficult; more difficult to use than K-means. : usually, does not do well in clustering high- dimensional datasets. : cluster models are not well understood (yet) 20 Ch. Eick: Introduction to Hierarchical Clustering and DBSCAN
Hierarchical Clustering Produces a set of nested clusters organized as a hierarchical tree Can be visualized as a dendrogram A tree like diagram that records the sequences of merges or splits 5 6 0.2 4 3 4 2 0.15 5 2 0.1 1 0.05 1 3 0 1 3 2 5 4 6 Ch. Eick: Introduction to Hierarchical Clustering and DBSCAN
Agglomerative Clustering Algorithm More popular hierarchical clustering technique Basic algorithm is straightforward 1. Compute the proximity matrix 2. Let each data point be a cluster 3. Repeat 4. Merge the two closest clusters 5. Update the proximity matrix 6. Until only a single cluster remains Key operation is the computation of the proximity of two clusters Different approaches to defining the distance between clusters distinguish the different algorithms Ch. Eick: Introduction to Hierarchical Clustering and DBSCAN
Starting Situation Start with clusters of individual points and a proximity matrix p1 p2 p3 p4 p5 . . . p1 p2 p3 p4 p5 . . Proximity Matrix . ... p1 p2 p3 p4 p9 p10 p11 p12 Ch. Eick: Introduction to Hierarchical Clustering and DBSCAN
Intermediate Situation After some merging steps, we have some clusters C1 C2 C3 C4 C5 C1 C2 C3 C3 C4 C4 C5 Proximity Matrix C1 C5 C2 ... p1 p2 p3 p4 p9 p10 p11 p12 Ch. Eick: Introduction to Hierarchical Clustering and DBSCAN
Intermediate Situation We want to merge the two closest clusters (C2 and C5) and update the proximity matrix. C1 C2 C3 C4 C5 C1 C2 C3 C3 C4 C4 C5 Proximity Matrix C1 C5 C2 ... p1 p2 p3 p4 p9 p10 p11 p12 Ch. Eick: Introduction to Hierarchical Clustering and DBSCAN
After Merging The question is How do we update the proximity matrix? C2 U C5 C1 C3 C4 C1 ? ? ? ? ? C2 U C5 C3 C3 ? C4 ? C4 Proximity Matrix C1 C2 U C5 ... p1 p2 p3 p4 p9 p10 p11 p12 Ch. Eick: Introduction to Hierarchical Clustering and DBSCAN
How to Define Inter-Cluster Similarity p1 p2 p3 p4 p5 . . . p1 Similarity? p2 p3 p4 p5 MIN MAX Group Average Distance Between Centroids Other methods driven by an objective function Ward s Method uses squared error . . . Proximity Matrix Ch. Eick: Introduction to Hierarchical Clustering and DBSCAN
How to Define Inter-Cluster Similarity p1 p2 p3 p4 p5 . . . p1 p2 p3 p4 p5 MIN MAX Group Average Distance Between Centroids Other methods driven by an objective function Ward s Method uses squared error . . . Proximity Matrix Ch. Eick: Introduction to Hierarchical Clustering and DBSCAN
How to Define Inter-Cluster Similarity p1 p2 p3 p4 p5 . . . p1 p2 p3 p4 p5 MIN MAX Group Average Distance Between Centroids Other methods driven by an objective function Ward s Method uses squared error . . . Proximity Matrix Ch. Eick: Introduction to Hierarchical Clustering and DBSCAN
How to Define Inter-Cluster Similarity p1 p2 p3 p4 p5 . . . p1 p2 p3 p4 p5 MIN MAX Group Average Distance Between Centroids Other methods driven by an objective function Ward s Method uses squared error . . . Proximity Matrix Ch. Eick: Introduction to Hierarchical Clustering and DBSCAN
How to Define Inter-Cluster Similarity p1 p2 p3 p4 p5 . . . p1 p2 p3 p4 p5 MIN MAX Group Average Distance Between Centroids Other methods driven by an objective function Ward s Method uses squared error . . . Proximity Matrix Ch. Eick: Introduction to Hierarchical Clustering and DBSCAN
Cluster Similarity: Group Average Proximity of two clusters is the average of pairwise proximity between points in the two clusters. proximity( Cluster j p , p ) i j p i i p Cluster = proximity( Cluster , Cluster ) j i j |Cluster |Cluster | | i j Need to use average connectivity for scalability since total proximity favors large clusters I1 I2 I3 I4 I5 I1 1.00 0.90 0.10 0.65 0.20 I2 0.90 1.00 0.70 0.60 0.50 I3 0.10 0.70 1.00 0.40 0.30 I4 0.65 0.60 0.40 1.00 0.80 I5 0.20 0.50 0.30 0.80 1.00 1 2 3 4 5 Ch. Eick: Introduction to Hierarchical Clustering and DBSCAN


")


")


