Delaware School Survey: Sussex County Alcohol Use Trends
Annual Delaware School Survey analyzes alcohol use trends among 5th, 8th, and 11th graders in Sussex County from 1999 to 2021. The data reflects self-reported alcohol consumption in the past 30 days for each grade, highlighting changes over the years.
Download Presentation

Please find below an Image/Link to download the presentation.
The content on the website is provided AS IS for your information and personal use only. It may not be sold, licensed, or shared on other websites without obtaining consent from the author.If you encounter any issues during the download, it is possible that the publisher has removed the file from their server.
You are allowed to download the files provided on this website for personal or commercial use, subject to the condition that they are used lawfully. All files are the property of their respective owners.
The content on the website is provided AS IS for your information and personal use only. It may not be sold, licensed, or shared on other websites without obtaining consent from the author.
E N D
Presentation Transcript
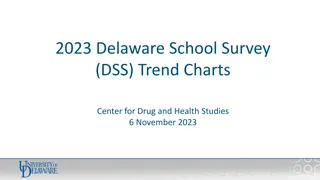
Delaware School Survey County Trend Charts Sussex County Center for Drug and Health Studies Department of Sociology and Criminal Justice University of Delaware
COVID-19 and Delaware School Survey Data 2020 Delaware School Survey Data: Due to the COVID-19 pandemic, the data collection for the Delaware School Survey was temporarily suspended. This suspension resulted in a gap in Delaware School Survey data for the 2020 survey year. However, due to an early administration that started in the 2019-2020 school year for the 8th grade survey, we were able to collect enough surveys in the 2019-2020 school year to report out on 8th grade data. This does allow us to explore the data, but only for that specific grade. Data on 5th and 11th grade students for the 2020 school year will not be available. 2021 Delaware School Survey Data: Change in administration: In response to the COVID-19 pandemic and the remote learning policies adopted by Delaware schools, the Delaware School Survey was converted to an online format in lieu of the traditional paper and pencil format. Districts and Schools could choose to participate using either the online format or paper and pencil format. The majority of the 2021 Delaware School Survey data was collected via an online survey platform Qualtrics. Both formats have the same questions and do not collect personal identifying information. Change in 2021 response rate: As a result of the COVID-19 pandemic, school closures, and changes in the approach to the Delaware School Survey administration, users of the 2021 Delaware School Survey data should note that response rates are lower than average. As a result, some changes observed in trend data among the 2020 and 2021 data may be partially influenced by these external events and the change in response rate. Sussex County 2 Center for Drug & Health Studies, 2021
Summary of the Delaware School Survey (DSS) The DSS is an annual survey of 5th, 8th, and 11th grade public school students in Delaware. The survey is used to estimate students attitudes and experiences with tobacco, drugs, alcohol, bullying, depression, and a variety of issues facing Delaware's youth. 2021 Sussex County sample size was: 5th Grade - 278 students 8th Grade - 517 students 11th Grade - 505 students Sussex County 3 Center for Drug & Health Studies, 2021
Sussex County Students' self reported alcohol use in the past 30 days by grade, 1999-Present 100% 11th Grade 90% 8th Grade 80% 5th Grade 70% 60% 50% 40% 30% 20% 10% 0% 1999 2000 2001 2002 2003 2004 2005 2006 2007 2008 2009 2010 2011 2012 2013 2014 2015 2016 2017 2018 2019 2020 2021 11th Grade 47% 52% 48% 49% 49% 45% 43% 48% 43% 44% 47% 36% 39% 37% 40% 34% 35% 32% 31% 29% 33% 8th Grade 28% 27% 25% 25% 25% 24% 26% 26% 24% 21% 23% 19% 18% 16% 13% 12% 12% 9% 5th Grade 2% 2% 2% 2% 1% 2% 2% 2% 2% 2% 15% * 10% 14% 9% 8% 5% 1% 1% 1% 1% 0% 1% 1% 0% 0% 1% 0% 1% * Sussex County Center for Drug & Health Studies, 2021 4
Sussex County Students' self reported binge drinking in the past two weeks by grade, 1999-Present 50% 45% 40% 11th Grade 35% 8th Grade 30% 25% 20% 15% 10% 5% 0% 1999 2000 2001 2002 2003 2004 2005 2006 2007 2008 2009 2010 2011 2012 2013 2014 2015 2016 2017 2018 2019 2020 2021 11th Grade 31% 34% 35% 33% 33% 31% 25% 34% 27% 29% 31% 21% 24% 23% 23% 18% 21% 20% 20% 18% 19% 8th Grade 17% 14% 13% 14% 14% 13% 14% 14% 12% 10% 11% 10% 10% 8% * 8% 5% 6% 3% 4% 5% 7% 3% 3% 2% Note: Binge alcohol use measured by Had 3 alcoholic drinks or more in a row in past 2 weeks Sussex County Center for Drug & Health Studies, 2021 5
Sussex County Students' perceived "great risk" of alcohol use by grade, 1999-Present 50% 45% 40% 35% 30% 25% 11th Grade 20% 8th Grade 15% 5th Grade 10% 5% 0% 1999 2000 2001 2002 2003 2004 2005 2006 2007 2008 2009 2010 2011 2012 2013 2014 2015 2016 2017 2019 2020 2021 11th Grade 25% 30% 27% 27% 26% 27% 27% 26% 32% 38% 36% 37% 39% 38% 31% 35% 32% 35% 37% 8th Grade 25% 26% 28% 24% 26% 28% 24% 29% 27% 34% 33% 36% 35% 31% 28% 30% 28% 30% 31% 5th Grade 38% 30% 28% 36% 38% 44% 44% 44% 44% 42% 26% 39% 37% 44% 40% 41% 39% 45% 43% 39% - - - - - - 35% * Note: Question was no longer asked for secondary after 2017 and not at all in 2018. For 5th grade, the answer option is a lot of risk . Sussex County Center for Drug & Health Studies, 2021 6
Sussex County Students' perceived "great risk" of binge drinking by grade, 1999-Present 100% 90% 80% 70% 60% 50% 11th Grade 40% 30% 8th Grade 20% 10% 0% 1999 2000 2001 2002 2003 2004 2005 2006 2007 2008 2009 2010 2011 2012 2013 2014 2015 2016 2017 2018 2019 2020 2021 11th Grade 40% 42% 41% 43% 40% 44% 43% 42% 46% 49% 52% 52% 55% 52% 45% 49% 44% 53% 54% 44% 47% 8th Grade 41% 46% 45% 44% 47% 49% 43% 48% 43% 50% 51% 52% 49% 48% 44% 43% 44% 44% 42% 39% 50% 37% 43% 40% * Note: Binge alcohol use measured by Had 3 alcoholic drinks or more in a row in past 2 weeks Sussex County Center for Drug & Health Studies, 2021 7
Delaware students self reported e-cigarette and/or vaping device use in the past 30 days by grade, 2014-Present 50% 45% 40% 35% 30% 25% 20% 15% 10% 5% 0% 2014 2015 2016 2017 2018 2019 2020 2021 11th Grade 6% 8% 11% 7% 14% 18% 9% * 8th Grade 2% 5% 6% 4% 7% 4% 6% * 4% 5th Grade 0% 0% 0% 0% 1% * * 8th and 11th Grade Question Changes: 2014-2015: Only e-cigarettes; 2016: E- cigarettes and vaping asked about in the same question; 2017: E-cigarettes and vaping asked about in separate questions, both reported here; 2018-2021: Specific brands also asked about (e.g., Juul). 5th Grade Question Changes: 2014-2015: No question asked; 2016- 2021: E-cigarettes and vaping asked about in the same question. State Trends Center for Drug & Health Studies, 2021 8
Delaware students perceived great risk in using e-cigarettes or a vaping device by grade, 2017-Present 50% 45% 40% 35% 30% 25% 20% 15% 10% 5% 0% 2017 2018 2019 2020 * 2021 11th Grade 17% 15% 27% 33% 8th Grade 12% 14% 30% 33% 31% State Trends Center for Drug & Health Studies, 2021 9
Sussex County Students' self reported cigarette use in the past 30 days by grade, 1999-Present 50% 45% 40% 11th Grade 35% 8th Grade 30% 5th Grade 25% 20% 15% 10% 5% 0% 1999 2000 2001 2002 2003 2004 2005 2006 2007 2008 2009 2010 2011 2012 2013 2014 2015 2016 2017 2018 2019 2020 2021 11th Grade 36% 31% 30% 24% 23% 22% 20% 23% 21% 19% 21% 18% 16% 17% 15% 13% 10% 8th Grade 24% 18% 16% 13% 13% 12% 13% 12% 10% 10% 11% 5th Grade 2% 2% 2% 1% 1% 1% 1% 1% 6% 6% 4% 5% 0% * 9% 7% 7% 5% 3% 3% 2% 1% 2% 1% 1% 1% 1% 1% 1% 1% 0% 0% 0% 0% 0% 0% 0% 0% 0% 0% * Sussex County Center for Drug & Health Studies, 2021 10
Sussex County Students' perceived "great risk" in smoking a pack of cigarettes daily by grade, 1999-Present 100% 90% 80% 70% 60% 50% 11th Grade 40% 8th Grade 30% 20% 5th Grade 10% 0% 1999 2000 2001 2002 2003 2004 2005 2006 2007 2008 2009 2010 2011 2012 2013 2014 2015 2016 2017 2018 2019 2020 2021 11th Grade 58% 66% 62% 64% 65% 69% 63% 66% 64% 71% 69% 66% 73% 68% 65% 67% 64% 66% 65% 67% 68% 8th Grade 49% 51% 50% 51% 52% 56% 49% 53% 51% 58% 54% 55% 52% 51% 44% 52% 51% 51% 47% 53% 57% 47% 48% 5th Grade 49% 46% 39% 53% 59% 62% 60% 60% 64% 61% 61% 55% 57% 54% 50% 50% 49% 54% 51% 52% 47% 58% * 49% * Note: Answer option is a lot of risk and not great risk for 5th graders Sussex County Center for Drug & Health Studies, 2021 11
Sussex County Students' self reported marijuana use in the past month by grade, 1999-Present 11th Grade 50% 8th Grade 45% 5th Grade 40% 35% 30% 25% 20% 15% 10% 5% 0% 1999 2000 2001 2002 2003 2004 2005 2006 2007 2008 2009 2010 2011 2012 2013 2014 2015 2016 2017 2018 2019 2020 2021 11th Grade 30% 26% 29% 28% 25% 26% 25% 26% 28% 23% 26% 23% 24% 26% 27% 26% 30% 23% 24% 24% 24% 12% * 8th Grade 17% 16% 13% 13% 13% 11% 14% 13% 10% 10% 10% 11% 8% 10% 7% 7% 8% 8% 7% 11% 8% 7% 4% 5th Grade 0% 0% 1% 0% 0% 0% 0% 0% 0% 0% 1% 0% 0% 0% 0% 0% 0% 0% 0% 0% 0% 1% * Sussex County Center for Drug & Health Studies, 2021 12
Sussex County Students' perceived "great risk" in smoking marijuana regularly by grade, 1999-Present 100% 90% 80% 70% 60% 50% 40% 30% 11th Grade 20% 8th Grade 10% 5th Grade 0% 1999 2000 2001 2002 2003 2004 2005 2006 2007 2008 2009 2010 2011 2012 2013 2014 2015 2016 2017 2018 2019 2020 2021 11th Grade 50% 52% 49% 49% 49% 51% 51% 49% 48% 57% 55% 53% 51% 46% 36% 37% 36% 34% 32% 22% 23% 8th Grade 58% 61% 62% 63% 64% 64% 56% 60% 58% 65% 64% 62% 58% 58% 47% 49% 51% 50% 43% 34% 48% 33% 37% 5th Grade 53% 47% 40% 54% 59% 65% 62% 62% 63% 59% 60% 53% 52% 52% 47% 49% 46% 53% 53% 51% 42% 29% * 47% * Note: Answer option is a lot of risk and not great risk for 5th graders Sussex County Center for Drug & Health Studies, 2021 13
Sussex County Students' reporting feeling safe in school by grade, 1999-Present 100% 90% 80% 70% 60% 50% 11th Grade 40% 8th Grade 30% 5th Grade 20% 10% 0% 1999 2000 2001 2002 2003 2004 2005 2006 2007 2008 2009 2010 2011 2012 2013 2014 2015 2016 2017 2018 2019 2020 2021 11th Grade 69% 80% 76% 84% 83% 81% 82% 83% 80% 77% 80% 82% 84% 84% 82% 84% 83% 81% 85% 75% 75% 8th Grade 68% 71% 75% 80% 80% 83% 84% 83% 80% 80% 81% 80% 84% 80% 81% 83% 82% 83% 82% 77% 81% 79% 81% 5th Grade 89% 90% 91% 95% 94% 95% 94% 93% 92% 92% 93% 91% 89% 93% 93% 92% 92% 94% 95% 94% 97% 78% * 93% * Sussex County Center for Drug & Health Studies, 2021 14
Sussex County Students' reporting fighting/ violence is a problem in school by grade, 1999-Present 100% 11th Grade 90% 8th Grade 80% 5th Grade 70% 60% 50% 40% 30% 20% 10% 0% 1999 2000 2001 2002 2003 2004 2005 2006 2007 2008 2009 2010 2011 2012 2013 2014 2015 2016 2017 2018 2019 2020 2021 11th Grade 35% 35% 29% 27% 31% 34% 31% 44% 43% 46% 50% 44% 43% 45% 43% 44% 38% 35% 26% 37% 26% 8th Grade 42% 41% 44% 37% 41% 42% 44% 47% 45% 47% 53% 54% 46% 50% 45% 36% 41% 35% 38% 36% 29% 45% 23% 5th Grade 46% 39% 39% 35% 35% 39% 40% 37% 31% 34% 31% 42% 31% 38% 35% 39% 34% 41% 38% 39% 40% 25% * 27% * Sussex County Center for Drug & Health Studies, 2021 15
Sussex County Students' reporting taking a weapon to school in the past year by grade, 1999-Present 50% 45% 40% 11th Grade 35% 8th Grade 30% 25% 20% 15% 10% 5% 0% 1999 2000 2001 2002 2003 2004 2005 2006 2007 2008 2009 2010 2011 2012 2013 2014 2015 2016 2017 2018 2019 2020 2021 11th Grade 9% 8th Grade 5% 6% 4% 6% 7% 7% 6% 6% 6% 4% 4% 4% 4% 2% 3% 6% 4% 3% 1% 3% 1% * 3% 2% 3% 3% 4% 3% 4% 4% 5% 5% 4% 3% 2% 3% 2% 5% 4% 2% 2% 1% 1% 0% 1% Sussex County Center for Drug & Health Studies, 2021 16
Sussex County Students' self reported prescription upper use in the past year by grade, 2007-Present 50% 11th Grade 45% 8th Grade 40% 35% 30% 25% 20% 15% 10% 5% 0% 2007 2008 2009 2010 2011 2012 2013 2014 2015 2016 2017 2018 2019 2020 2021 11th Grade 4% 1% 3% 2% 1% 1% 1% 1% 1% 1% 1% 0% 1% 0% * 8th Grade 1% 2% 1% 1% 1% 0% 1% 0% 0% 0% 0% 0% 1% 0% 0% Note: Question was first asked in 2007 Sussex County Center for Drug & Health Studies, 2021 17
Sussex County Students' self reported downer use in the past year by grade, 1999-Present 50% 45% 11th Grade 40% 35% 8th Grade 30% 25% 20% 15% 10% 5% 0% 1999 2000 2001 2002 2003 2004 2005 2006 2007 2008 2009 2010 2011 2012 2013 2014 2015 2016 2017 2018 2019 2020 2021 11th Grade 5% 8th Grade 4% 4% 6% 5% 6% 2% 3% 4% 4% 5% 5% 3% 3% 3% 2% 3% 1% 3% 2% 2% 0% * 2% 2% 2% 2% 2% 3% 2% 1% 1% 1% 2% 1% 2% 1% 1% 0% 0% 0% 0% 1% 1% 0% 0% Sussex County Center for Drug & Health Studies, 2021 18
Sussex County Students' self reported hallucinogen use in the past year by grade, 1999-Present 50% 11th Grade 45% 40% 8th Grade 35% 30% 25% 20% 15% 10% 5% 0% 1999 2000 2001 2002 2003 2004 2005 2006 2007 2008 2009 2010 2011 2012 2013 2014 2015 2016 2017 2018 2019 2020 2021 11th Grade 12% 8th Grade 9% 7% 4% 4% 4% 4% 5% 4% 4% 3% 3% 3% 4% 3% 4% 4% 3% 4% 4% 3% 2% * 5% 4% 2% 2% 2% 2% 2% 2% 1% 2% 2% 1% 1% 1% 1% 1% 0% 1% 1% 1% 0% 0% 0% Sussex County Center for Drug & Health Studies, 2021 19
Sussex County Students' self reported heroin use in the past year by grade, 1999-Present 50% 11th Grade 45% 8th Grade 40% 35% 30% 25% 20% 15% 10% 5% 0% 1999 2000 2001 2002 2003 2004 2005 2006 2007 2008 2009 2010 2011 2012 2013 2014 2015 2016 2017 2018 2019 2020 2021 11th Grade 1% 8th Grade 1% 1% 0% 0% 0% 1% 0% 1% 0% 1% 1% 0% 1% 1% 1% 1% 0% 1% 0% 1% 0% * 1% 2% 1% 1% 1% 1% 1% 2% 2% 1% 1% 0% 1% 1% 1% 0% 0% 1% 0% 0% 0% 0% 0% Sussex County Center for Drug & Health Studies, 2021 20
Sussex County Students' self reported crack or cocaine use in the past year by grade, 2005-Present 50% 11th Grade 45% 8th Grade 40% 35% 30% 25% 20% 15% 10% 5% 0% 2005 2006 2007 2008 2009 2010 2011 2012 2013 2014 2015 2016 2017 2018 2019 2020 2021 11th Grade 4% 6% 4% 3% 3% 3% 2% 3% 2% 1% 2% 1% 2% 1% 1% 0% * 8th Grade 3% 3% 2% 2% 2% 1% 1% 1% 1% 1% 2% 1% 0% 1% 0% 1% 0% Note: Question first asked in 2005 Sussex County Center for Drug & Health Studies, 2021 21
Sussex County Students' self reported pain killer use in the past year by grade 50% 11th Grade 45% 8th Grade 40% 35% 30% 25% 20% 15% 10% 5% 0% 2002 2003 2004 2005 2006 2007 2008 2009 2010 2011 2012 2013 2014 2015 2016 2017 2018 2019 2020 2021 11th Grade 16% 13% 14% 12% 14% 13% 12% 14% 11% 10% 8th Grade 8% 6% 7% 8% 8% 7% 3% 7% 3% 4% 3% 2% 1% * 6% 4% 5% 6% 4% 4% 5% 3% 2% 3% 2% 2% 3% 3% 2% 3% Note: Question first asked in 2002 Sussex County Center for Drug & Health Studies, 2021 22
Sussex County Students' self reported steroid use in the past year by grade, 2008-Present 50% 11th Grade 45% 8th Grade 40% 35% 30% 25% 20% 15% 10% 5% 0% 2008 2009 2010 2011 2012 2013 2014 2015 2016 2017 2018 2019 2020 2021 11th Grade 0% 0% 1% 1% 1% 0% 0% 1% 1% 2% 0% 1% 0% * 8th Grade 0% 0% 1% 1% 0% 1% 0% 0% 0% 0% 0% 0% 0% 0% Note: Question first asked in 2008 Sussex County Center for Drug & Health Studies, 2021 23
Sussex County Students' self reported ADHD medicine use in the past year by grade, 2008-Present 50% 11th Grade 45% 8th Grade 40% 5th Grade 35% 30% 25% 20% 15% 10% 5% 0% 2002 2003 2004 2005 2006 2007 2008 2009 2010 2011 2012 2013 2014 2015 2016 2017 2018 2019 2020 2021 11th Grade 3% 8th Grade 4% 4% 4% 4% 4% 4% 5% 5% 3% 4% 2% 3% 4% 2% 2% 2% 1% 2% * 2% - 2% 2% 2% 2% 1% 1% 1% 1% 1% 1% 1% 1% 0% 0% 0% 1% 1% 0% 1% 5th Grade 0% 0% 1% 0% 1% 0% 0% 1% 0% 1% 0% 0% 0% 0% 0% 0% 0% 0% * Note: Question first asked in 2002 and 2003 for 5th graders Sussex County Center for Drug & Health Studies, 2021 24
Sussex County Students' self reported over the counter drugs use in the past year by grade, 2008-Present 50% 11th Grade 45% 8th Grade 40% 5th Grade 35% 30% 25% 20% 15% 10% 5% 0% 2008 2009 2010 2011 2012 2013 2014 2015 2016 2017 2018 2019 2020 2021 11th Grade 9% 9% 7% 9% 9% 6% 5% 6% 5% 6% 5% 3% 2% * 8th Grade 8% 8% 6% 7% 7% 6% 5% 4% 5% 4% 4% 4% 3% 3% 5th Grade 1% 2% 1% 2% 1% 1% 1% 2% 1% 1% 1% 0% 1% * Sussex County Center for Drug & Health Studies, 2021 25
