Current Trends and Issues in the Health Care Workforce
Presentation by Robert Martiniano on current factors affecting the health care workforce, including demographic shifts, reimbursement changes, and delivery system evolution. The Center for Health Workforce Studies at SUNY Albany plays a crucial role in collecting and analyzing data to inform public policies and workforce dynamics. Various topics covered include supply projections, shortage area designations, and ongoing challenges in the health care industry.
Download Presentation

Please find below an Image/Link to download the presentation.
The content on the website is provided AS IS for your information and personal use only. It may not be sold, licensed, or shared on other websites without obtaining consent from the author. Download presentation by click this link. If you encounter any issues during the download, it is possible that the publisher has removed the file from their server.
E N D
Presentation Transcript
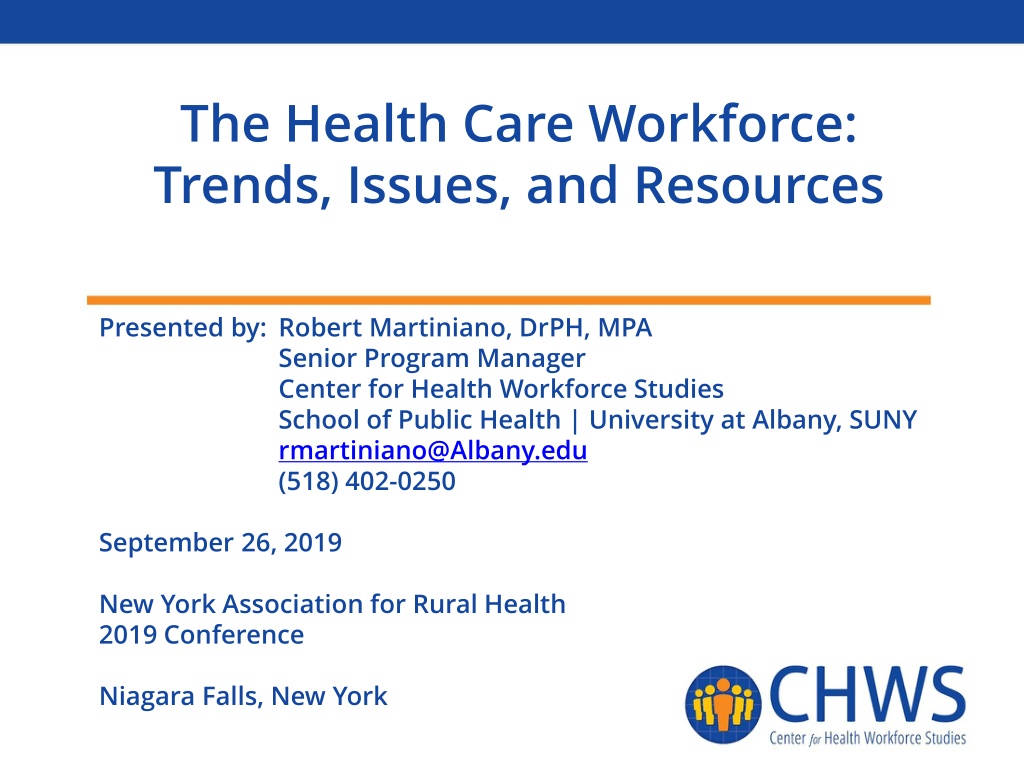
The Health Care Workforce: Trends, Issues, and Resources Presented by: Robert Martiniano, DrPH, MPA Senior Program Manager Center for Health Workforce Studies School of Public Health | University at Albany, SUNY rmartiniano@Albany.edu (518) 402-0250 September 26, 2019 New York Association for Rural Health 2019 Conference Niagara Falls, New York
The Center for Health Workforce Studies at SUNY Albany School of Public Health Established in 1996 Based at the UAlbany School of Public Health Committed to collecting and analyzing data to understand workforce dynamics and trends Goal to inform public policies, the health and education sectors and the public Broad array of funders supporting our research www.chwsny.org 2
Todays Presentation Current Factors Affecting Health Care Current Trends o Supply o Production o Projections Licensing Updates Shortage Area Designations o HPSAs o MUAs/Ps o Rural Health Clinics Service Obligated Programs What to Think About o Continuing Issues in Health Care o Jobs for the Future Questions/Discussion http://chws.albany.edu 3
Current Factors Affecting Health Care Demographic Shift o Aging population (especially in rural areas) o More diverse population Health Care Reimbursement o Value based payments o Potential federal and state cuts o DSRIP Health Care Delivery System o Mergers, acquisitions, and consolidations o Aging health care workforce o Shift to outpatient services and focus on preventative services o Understanding population health and social determinants of health o Potential changes in scope of practice Other o Increase in minimum wage http://chws.albany.edu 4
As You Think About the Data Geography o Does the level of geography make sense? Are small problems being masked by large populations? How are things defined? o Graduation data -- nurse practitioner vs. clinical nurse specialist o Clinical data admissions for all diabetes vs. primary diagnosis of diabetes How is the information presented? o Rate, ratio, percentage What is the population base used for calculation? http://chws.albany.edu 5
As You Think About the Data What does the data tell me? What does the data not tell me? Is the question asked, if existing data, what I am trying to answer? Does the indicator make sense for my community? Are there significant variations in the data that can be explained? http://chws.albany.edu 6
Regions http://chws.albany.edu 7
Growth in Health Care Jobs in New York State Outpacing Growth in Jobs in Other Sectors Employment Growth in New York State, 2000-2018 (Standardized to 2000) Source: New York State Department of Labor, Quarterly Census of Employment and Wages http://chws.albany.edu 9
Difference in Growth in Jobs Even More Dramatic in Upstate New York Employment Growth Outside of NYC, 2000-2018 (Standardized to 2000) Source: New York State Department of Labor, Quarterly Census of Employment and Wages http://chws.albany.edu 10
Health Care Employment Growth in health care employment in rural areas slower than in regions with large urban areas Employment in home health care is growing the fastest, though has the least number of jobs Growth in hospitals vary by region Nursing home employment decreased in many upstate regions Employment in ambulatory care settings grew in all upstate regions but one Employment in home health care grew the fastest but was inconsistent across regions http://chws.albany.edu 11
Growth in Health Care in Rural Areas Slower than in Urban Areas Change Between Region 2014 2015 2016 2017 2018 Number Percent 3,148 1,415 4,507 8,471 737 811 498 4,337 23,924 Capital District Central New York Finger Lakes Hudson Valley Mohawk Valley North Country Southern Tier Western New York Total 57,226 39,123 64,791 113,251 26,247 18,215 28,650 71,039 418,542 57,919 39,334 65,592 116,098 26,659 18,601 28,816 71,446 424,465 58,613 40,075 67,125 118,275 26,816 18,898 29,062 72,658 431,522 59,764 40,258 68,200 120,732 27,177 18,976 28,924 73,287 437,318 60,374 40,538 69,298 121,722 26,984 19,026 29,148 75,376 442,466 5.5% 3.6% 7.0% 7.5% 2.8% 4.5% 1.7% 6.1% 5.7% Source: New York State Department of Labor, Quarterly Census of Employment and Wages http://chws.albany.edu 12
Growth in Health Care Varies by Setting Change Between Region 2014 2015 2016 2017 2018 Number Percent 12,499 -472 8,318 3,549 23,894 Hospitals Nursing Homes Ambulatory Care Home Health Care Total 165,771 86,143 138,056 28,602 418,572 168,400 87,138 140,065 28,862 424,465 171,766 87,022 142,366 30,368 431,522 174,826 86,034 144,757 31,701 437,318 178,270 85,671 146,374 32,151 442,466 7.5% -0.5% 6.0% 12.4% 5.7% Source: New York State Department of Labor, Quarterly Census of Employment and Wages http://chws.albany.edu 13
Growth in Hospitals Vary by Region Change Between Region 2014 2015 2016 2017 2018 Number Percent Capital District Central New York Finger Lakes Hudson Valley Mohawk Valley North Country Southern Tier Western New York Total 23,552 13,715 30,406 38,157 11,435 8,957 13,396 26,153 165,771 23,887 13,708 30,977 39,297 11,585 9,216 13,408 26,322 168,400 24,365 13,755 32,027 40,633 11,667 9,438 13,505 26,376 171,766 24,907 13,931 32,738 42,007 11,773 9,507 13,506 26,457 174,826 25,225 14,066 33,911 42,156 11,838 9,710 13,535 27,829 178,270 1,673 351 3,505 3,999 403 753 139 1,676 12,499 7.1% 2.6% 11.5% 10.5% 3.5% 8.4% 1.0% 6.4% 7.5% Source: New York State Department of Labor, Quarterly Census of Employment and Wages http://chws.albany.edu 14
Nursing Home Employment Decreased in Many Upstate Regions Change Between Region 2014 2015 2016 2017 2018 Number Percent 256 -219 649 -713 -274 -176 117 -112 -472 Capital District Central New York Finger Lakes Hudson Valley Mohawk Valley North Country Southern Tier Western New York 11,167 8,589 13,299 21,118 6,692 3,063 6,621 15,594 86,143 11,278 8,833 13,624 21,325 6,881 3,023 6,631 15,543 87,138 11,203 8,909 13,757 21,102 6,834 3,019 6,692 15,506 87,022 11,490 8,522 13,842 20,310 6,724 2,975 6,689 15,482 86,034 11,423 8,370 13,948 20,405 6,418 2,887 6,738 15,482 85,671 2.3% -2.5% 4.9% -3.4% -4.1% -5.7% 1.8% -0.7% -0.5% Total Source: New York State Department of Labor, Quarterly Census of Employment and Wages http://chws.albany.edu 15
Employment in Ambulatory Care Generally Grew in Upstate Regions Change Between Region 2014 2015 2016 2017 2018 Number Percent 1,108 1,247 -1,147 4,418 212 345 224 1,911 8,318 Capital District Central New York Finger Lakes Hudson Valley Mohawk Valley North Country Southern Tier Western New York Total 19,118 14,677 17,497 42,939 6,755 5,358 7,572 24,140 138,056 19,476 14,690 17,067 44,305 6,823 5,559 7,697 24,448 140,065 19,866 15,313 16,863 44,693 6,845 5,637 7,728 25,421 142,366 19,933 15,622 16,719 46,360 6,968 5,698 7,675 25,782 144,757 20,226 15,924 16,350 47,357 6,967 5,703 7,796 26,051 146,374 5.8% 8.5% -6.6% 10.3% 3.1% 6.4% 3.0% 7.9% 6.0% Source: New York State Department of Labor, Quarterly Census of Employment and Wages http://chws.albany.edu 16
Employment in Home Health Care Grew the Fastest but was Inconsistent Across Regions Change Between Region 2014 2015 2016 2017 2018 Number Percent 81 36 1,500 767 396 -111 18 862 3,549 Capital District Central New York Finger Lakes Hudson Valley Mohawk Valley North Country Southern Tier Western New York 3,419 2,142 3,589 11,037 1,365 837 1,061 5,152 28,602 3,278 2,103 3,924 11,171 1,370 803 1,080 5,133 28,862 3,179 2,098 4,478 11,847 1,470 804 1,137 5,355 30,368 3,434 2,183 4,901 12,055 1,712 796 1,054 5,566 31,701 3,500 2,178 5,089 11,804 1,761 726 1,079 6,014 32,151 2.4% 1.7% 41.8% 6.9% 29.0% -13.3% 1.7% 16.7% 12.4% Total Source: New York State Department of Labor, Quarterly Census of Employment and Wages http://chws.albany.edu 17
Hospitals Recruitment and Retention Issues Clinical Laboratory Technicians Clinical Laboratory Technologists Experienced RNs Nurse Practitioners Psychiatric Nurse Practitioners Physician Assistants Surgical Technicians http://chws.albany.edu 18
Nursing Home Recruitment and Retention Issues CNAs Experienced and New RNs Licensed Practical Nurses MDS Coordinators Nurse Directors/Managers Occupational Therapists Occupational Therapy Assistants Physical Therapists Physical Therapy Assistants http://chws.albany.edu 19
Home Health Care Recruitment and Retention Issues Home Health Aides Homemakers Personal Care Aides Occupational Therapists Physical Therapists Registered Nurses Respiratory Therapists Social Workers http://chws.albany.edu 20
FQHC Recruitment and Retention Issues Case Coordinators Dentists Licensed Practical Nurses Nurse Practitioners, including Psychiatric Primary Care Physicians Psychiatrists Registered Nurses Social Workers Substance Abuse Counselors http://chws.albany.edu 21
Lower Percentage of Population in Rural Areas Obtaining College Degrees High School Graduate, Including Equivalency Graduate or Professional Degree Less than High School Graduate Associates Degree Bachelor's Degree Region Capital District Central New York Finger Lakes Hudson Valley Long Island Mohawk Valley New York City North Country Southern Tier Western New York Statewide 8.4% 10.1% 9.9% 11.3% 9.4% 11.7% 18.9% 11.5% 9.6% 9.3% 13.9% 45.5% 47.6% 46.1% 40.8% 42.5% 53.2% 38.0% 55.5% 50.0% 49.3% 42.2% 12.0% 12.4% 12.2% 8.3% 8.6% 12.5% 6.4% 11.2% 11.9% 12.2% 8.7% 18.8% 17.0% 17.9% 21.0% 21.6% 13.0% 21.5% 11.5% 14.9% 16.3% 19.9% 15.3% 13.0% 13.9% 18.7% 17.8% 9.6% 15.2% 10.3% 13.6% 12.9% 15.4% Source: American Community Survey, 5-Year Estimates, 2013 2017, Table S1501 http://chws.albany.edu 23
Significant Regional Differences in Graduations by Occupation Capital District Central New York Finger Lakes Hudson Valley Mohawk Valley North Country Southern Tier Western New York Occupation Dental Assistants Dental Hygienists Dietetic Technicians Dietitians and Nutritionists Licensed Practical Nurses Medical and Clinical Laboratory Technicians Medical and Clinical Laboratory Technologists Medical Assistants Nurse Practitioners/Clinical Nurse Specialists Occupational Therapists Occupational Therapy Assistants and Aides Pharmacists Physical Therapist Assistants and Aides Physical Therapists Physician Assistants Respiratory Therapists RNs Social Workers Totals 16 30 14 0 230 56 0 7 0 186 71 31 0 0 270 17 10 67 80 48 73 14 0 0 325 22 28 165 63 65 85 0 0 3 0 0 22 49 1 86 367 18 30 126 90 128 35 172 45 203 134 20 1,127 203 3,147 29 0 0 207 33 0 0 71 20 1 101 39 42 47 142 0 0 0 0 9 0 19 170 43 34 63 200 23 160 61 10 0 0 0 0 0 14 25 19 0 327 54 62 0 0 26 283 0 0 0 0 0 0 82 28 54 60 0 0 0 20 38 89 8 603 90 1,496 21 183 59 26 863 25 85 0 0 676 47 1,157 36 40 17 0 22 519 1,960 172 3,149 1,217 190 2,322 8 0 0 2,077 1,199 652 Source: US Education Department, IPEDS, 2016-2017 http://chws.albany.edu 24
Nationally, Employment in Health Care Growing Faster than in Other Sectors Sources: U.S. Bureau of Labor Statistics, employment projections, 2016-2026: Table 1.9: 2016-26 Industry- occupation matrix data, by industry; Table 2.7: Employment and output by industry, 2006, 2016, and projected 2026; Current Employment Statistics national estimates for employment, hours, and earnings. http://chws.albany.edu 26
Nationally, Employment in Home Health Care Growing Faster than in Other Health Care Settings Sources: U.S. Bureau of Labor Statistics, employment projections, 2016-2026: Table 1.9: 2016-26 Industry- occupation matrix data, by industry; Table 2.7: Employment and output by industry, 2006, 2016, and projected 2026; Current Employment Statistics national estimates for employment, hours, and earnings. http://chws.albany.edu 27
Ambulatory Care Projected to Grow the Fastest Employment Percent Change Occupation Setting 2016 2026 Ambulatory Care Hospitals Nursing Homes Ambulatory Care Hospitals Nursing Homes Ambulatory Care Hospitals Nursing Homes Ambulatory Care Hospitals Nursing Homes Ambulatory Care Hospitals Nursing Homes Ambulatory Care Hospitals Nursing Homes Ambulatory Care Hospitals Nursing Homes Ambulatory Care Hospitals Nursing Homes 25,100 24,690 18,530 18,950 12,890 12,070 23,070 33,000 20,860 61,580 41,860 40,320 9,190 12,590 10,340 6,310 10,190 6,070 9,650 13,750 9,760 33,480 26,360 24,590 34,980 26,550 23,240 26,000 13,760 15,040 31,900 36,400 25,380 87,620 45,990 51,160 12,470 13,450 11,730 8,440 11,020 7,260 12,380 14,050 11,830 44,260 28,140 28,550 39.4% 7.5% 25.4% 37.2% 6.7% 24.6% 38.3% 10.3% 21.7% 42.3% 9.9% 26.9% 35.7% 6.8% 13.4% 33.8% 8.1% 19.6% 28.3% 2.2% 21.2% 32.2% 6.8% 16.1% Capital District Central New York Finger Lakes Hudson Valley Mohawk Valley North Country Southern Tier Western New York Source: New York State Department of Labor, 2016 2016 Statewide and Region Long Term Industry Projections http://chws.albany.edu 28
Annual New Openings, 2016 - 2026 Vary by Region Capital District Central New York Finger Lakes Hudson Valley Mohawk Valley North Country Southern Tier Western New York Occupation Healthcare Social Workers Mental Health & Substance Abuse Social Workers Pharmacists Physician Assistants Occupational Therapists Physical Therapists Speech-Language Pathologists Registered Nurses Nurse Practitioners Laboratory Technologists Laboratory Technicians Dental Hygientists EMTs & Paramedics Pharmacy Technicians Licensed Practical Nurses Home Health Aides Nursing Assistants Dental Assistants Medical Assistants Personal Care Aides Source: New York State Department of Labor, 2016 2016 Statewide and Region Long Term Occupational Projections 110 60 150 230 50 30 50 110 90 70 100 40 100 70 940 90 60 50 70 170 130 400 980 980 160 200 80 30 80 30 60 30 560 70 40 N/A 60 80 60 310 440 590 130 140 1,080 110 50 90 60 100 60 970 120 80 100 100 140 120 380 900 920 180 160 200 120 150 100 160 110 60 30 20 20 30 20 390 30 20 10 30 30 50 210 380 440 50 50 30 20 30 20 30 10 270 20 10 10 30 30 30 140 220 290 50 40 710 50 20 20 20 30 20 390 40 20 30 40 60 40 170 230 450 60 80 110 80 80 60 100 110 1,750 140 1,010 90 30 30 120 80 160 520 80 60 120 260 170 680 2,250 1,760 400 580 4,170 1,030 960 170 320 2,170 1,480 1,920 1,090 1,040 http://chws.albany.edu 29
Update of Licensing Requirements Provisional Licenses o Clinical laboratory technologists o Certified Histology Technicians Licensing for Pathologists Assistants Continued Exemptions for Mental Health Professions Working at State Facilities o OMH, OPWDD, and OASAS o Office of Children and Family Services o Department of Corrections and Community Supervision o Local Government Units o Varies based on profession http://chws.albany.edu 31
Update of Licensing Requirements BSN in 10 o Effective June 18, 2019 o RNs with RN diplomas or with associate degrees must obtain BSN within 10 years o Conditional registration may be granted for one year and may be extended for good cause NYS has seen an increase in BSN Completer Programs o Number of BSN completer programs has increased o Higher percentage of total graduations and baccalaureate graduations are from BSN completers http://chws.albany.edu 32
Type of Shortage Area Designations Health Professional Shortage Areas o Specialties Primary care Dental health Mental health o Types Geographic Special population Facilities Other facilities (not-for-profit outpatient) Correctional facilities State and county mental health hospitals Auto HPSAs http://chws.albany.edu 34
Auto HPSAs Auto HPSAs include o Include Federally qualified health centers (FQHCs) FQHC look-alikes Rural health clinics Indian Health Services o Do not generally need to apply for designation o Scored based on Population in service area Population to provider ratio Nearest source of care o Rural health clinics Need to go through NHSC site approval to get Auto HPSA designation http://chws.albany.edu 35
Type of Shortage Area Designations Medically Underserved Areas/Populations o Specialties Primary care o Types Geographic Special population o Scores based on Physicians per 1,000 population Percent elderly Percent poverty Infant mortality rate http://chws.albany.edu 36
Our Role Responsible for submitting all shortage area designations Provide technical assistance on shortage area designations and service obligated programs Update providers as necessary o Location/address o Specialty Limited to primary care o Setting Limited to outpatient/ambulatory care o Clinical hours o Other hours http://chws.albany.edu 37
Our Role Supply and update secondary data sources o Medicaid claims o OASAS for alcoholism and substance abuse o Fluoridation o Travel times Manage Auto HPSA Designation Process o Review all requests from Auto HPSAs o Review secondary data sources o Submit as necessary o Manage Points of Contacts http://chws.albany.edu 38
What Are Designations Used For? HPSAs o Federal service obligated programs National Health Service Corps Nurse Corps Visitor Exchange Program o State service obligated programs Doctors Across New York Primary Care Service Corps Social Worker Loan Repayment New York State 30 J-1 Visa Waiver Program o Appalachian Regional Commission Primary Care Specialty Care o Grants o Rural Health Clinic Certification http://chws.albany.edu 39
What Are Designations Used For? MUAs o 330 funding for federally qualified health centers o Grants o State service obligated programs Doctors Across New York New York State 30 J-1 Visa Waiver Program o Rural Health Clinic Certification http://chws.albany.edu 40
Service Obligated Programs Over 20 service obligated programs New Yorkers can use CHWS created a web site with programs listed Includes information o Brief description of program o Sponsor o Type (loan repayment, scholarship, J-1 Visa Waiver) o Length of service or commitment o Type of designation required (if required) o Minimum HPSA score needed (if needed) o Health professionals supported o Electronic link to program http://chws.albany.edu 41
Service Obligated Programs Links to job sites o Health Workforce Connector Active NHSC, Nurse Corps, and SUD sites Current score for placement Job Opportunities o 3RNet Jobs in rural areas Link to HPSA Find Link to join our mailing list http://chws.albany.edu 42
Potential Changes in Health Care Aging population with more residential options Individuals sicker, with more comorbidities when finally entering hospitals Training in health care needs to consider o Career ladders o Certifications (in addition to formal degrees) o Interdisciplinary training Nursing ratios in hospitals Expanding scope of practice o Community paramedics o Dental hygiene therapists o Psychologists with prescriptive authority http://chws.albany.edu 43
Jobs for the Future Home Health Care o Home health aides o Personal care aides Ambulatory Care o RNs o LPNs (also nursing homes) o Medical assistants o Emerging titles Case managers Community health workers Health coaches Patient navigators Primary Care o Physicians o Nurse practitioners o Physician assistants Behavioral Health http://chws.albany.edu 44
Links to Sites Center for Health Workforce Studies https://www.chwsny.org/ Health Careers http://www.healthcareersinfo.net/ Service Obligated Programs https://www.chwsny.org/related-sites/service-obligated- programs/ http://chws.albany.edu 45
Questions? For more information, please email me at: Visit us on: www.chwsny.org 46
