Creating an Iron Chef in Statistics Classes
Explore the innovative approach of implementing an Iron Chef model in statistics classes through the use of Model-Eliciting Activities (MEAs) to engage students in statistical thinking. Discover how the CATALST research foundations have led to a radical shift in content and pedagogy, emphasizing real-world problems and messy data. Learn how MEAs challenge students to invent and test models, fostering a deeper understanding of statistical concepts while promoting change in teaching and learning practices.
Download Presentation

Please find below an Image/Link to download the presentation.
The content on the website is provided AS IS for your information and personal use only. It may not be sold, licensed, or shared on other websites without obtaining consent from the author.If you encounter any issues during the download, it is possible that the publisher has removed the file from their server.
You are allowed to download the files provided on this website for personal or commercial use, subject to the condition that they are used lawfully. All files are the property of their respective owners.
The content on the website is provided AS IS for your information and personal use only. It may not be sold, licensed, or shared on other websites without obtaining consent from the author.
E N D
Presentation Transcript
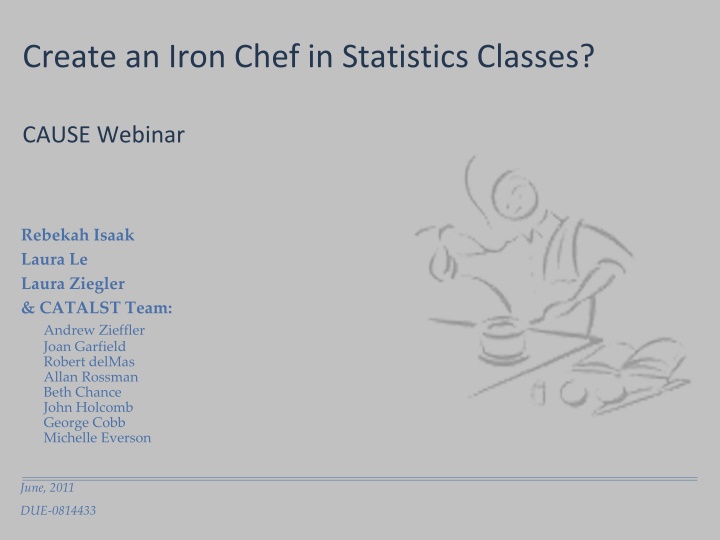
Create an Iron Chef in Statistics Classes? CAUSE Webinar Rebekah Isaak Laura Le Laura Ziegler & CATALST Team: Andrew Zieffler Joan Garfield Robert delMas Allan Rossman Beth Chance John Holcomb George Cobb Michelle Everson June, 2011 DUE-0814433
Outline Introduction CATALST Research Foundations How We Create the Statistical Iron Chef Teaching Experiment Student Learning To Bring About Change
Introduction Following a recipe step-by-step is to novice thinking as understanding affordances involved in truly cooking is to expert thinking
CATALST Research Foundations Origins of CATALST George Cobb new ideas about content Daniel Schwartz plowing the field Tamara Moore MEAs in other fields
CATALST Research Foundations Curricular materials based on research in cognition and learning and instructional design principles Materials expose students to the power of statistics, real problems, and real, messy data Radical changes in content and pedagogy: No t-Tests; randomization and re-sampling approaches; MEAs
How We Create the Statistical Iron Chef Model-Eliciting Activities (MEAs) Definition (from SERC website): Model-eliciting activities (MEAs) are activities that encourage students to invent and test models. They are posed as open-ended problems that are designed to challenge students to build models in order to solve complex, real-world problems.
How We Create the Statistical Iron Chef Model-Eliciting Activities (MEAs) Start each of three units with a messy, real-world problem Example: iPod Shuffle MEA Create rules to allow them to judge whether or not the shuffle feature on a particular iPod appears to produce randomly generated playlists. End each unit with an expert solution http://serc.carleton.edu/sp/library/mea/what.html
How We Create the Statistical Iron Chef Goals for the course: Immerse students in statistical thinking Change the pedagogy and content Move to randomization/simulation approach to inference Have students really cook
How We Create the Statistical Iron Chef Unit 1: Models and Simulation Develop ideas of randomness and modeling random chance Build an understanding of informal inference that leads to an introduction to formal inference
How We Create the Statistical Iron Chef Unit 1: Models and Simulation Student Learning Goals: Understand the need to use simulation to address questions involving statistical inference. Develop an understanding of how we simulate data to represent a random process or model. Understand how to use the results/outcomes generated by a model to evaluate data observed in a research study. Learn TinkerPlots
How We Create the Statistical Iron Chef Unit 2: Models for Comparing Groups Extend the concept of models and formal inference by introducing resampling methods Student Learning Goals Learn to model the variation due to random assignment (i.e., Randomization Test) under the assumption of no group differences Learn to model the variation due to random sampling (i.e., Bootstrap Test) under the assumption of no group differences
How We Create the Statistical Iron Chef Unit 3: Estimating Models Using Data Continue to use resampling methods (i.e. bootstrap intervals) to develop ideas of estimation
Teaching Experiment What is it? They involve designing, teaching, observing, and evaluating a sequence of activities to help students develop a particular learning goal 2010/2011: Two-semester teaching experiment (Year 3 of grant)
Preparation for the Teaching Experiment Reading, thinking, writing, adapting MEAs Planning and decisions about sequence of course content, software choice(s), etc. Conversations and working sessions with visiting scholars
Teaching Experiment: Semester 1 Research Questions: How would students respond to the demands of the course? What does it take to prepare instructors to teach the course? How can we see evidence of the students reasoning developing throughout this course?
Teaching Experiment: Semester 1 1 graduate student at UMN taught 1 section of undergraduate course (~30 students), while 2-3 graduate students observed Unit 1 was written (and MEAs for Unit 2 and 3) Plans/Outline for Unit 2 and 3 Plans for software (TinkerPlots, R- Tools, and R) Many weekly meetings to debrief and plan
Ch-ch-ch-ch-Changes Team met in January to make changes based on what was learned during the semester (also met with 6 potential implementers) Re-sequencing of some topics (e.g., bootstrap) Course readings added (content) and removed (abstracts only) Assessments adapted as needed Group exams rather than individual
Teaching Experiment: Semester 2 Research Questions: Is the revised sequence more coherent and conceptually viable for students? How effective is the collaborative teaching model in preparing instructors for teaching the CATALST course? Can we take the experiences of these instructors and use them to help create lesson plans for future CATALST teachers?
Teaching Experiment: Semester 2 3 graduate students each taught a section at U of M (~30 students each) in active learning classrooms Also taught in 1 course at North Carolina State University Many meetings (teaching team, CATALST PIs, instructors, curriculum writing, Herle Skype's into the meeting) Units 1 & 2 were written Plan/Outline for new Unit 3
Teaching Experiment: What We Have Learned We can teach students to cook Based on interview and assessment data, students seem to be thinking statistically (even after only 6 class periods!) We can change the content/pedagogy of the introductory college course We can use software at this level that is rooted in how students learn rather than purely analytical
Student Learning: Positive Attitudes Percent who selected Agree or Strongly Agree COURSE EVALUATION ITEM (N = 102) I feel that statistics offers valuable methods to analyze data to answer important research questions. I feel that as a result of taking this course, I can successfully use statistics. This course helped me understand statistical information I hear or read about from the news media. Learning to create models with TinkerPlots helped me learn to think statistically. Learning to use TinkerPlots was an important part of learning statistics. I think I am well-prepared for future classes that require an understanding of statistics. 95.0% 88.2% 86.3% 85.0% 81.4% 85.0%
Student Learning: Preliminary Results Informal observations Different ways of answering the same problem Small group discussions provide insight into student thinking, particularly on hard concepts Student comments I really didn t anticipate enjoying a stats class this much! I would recommend this course to anyone I am very satisfied with this course. Really interesting way to learn statistics!
Challenges We are Working On Textbook/materials TinkerPlots scaffolding Get students to explore Assessments Individual vs. cooperative Use of software on exams (not every student has a laptop) Cheat sheets Grading Large courses
To Bring About Change It takes a village It takes time It takes flexibility
Create an Iron Chef in Statistics Classes? YES!!!
http://catalystsumn.blogspot.com/ http://www.tc.umn.edu/~catalyst
