Cost Savings in Postoperative Pain Management with NOL-Guided Anesthesia
Acute postoperative pain is a significant issue globally, with high prevalence rates and potential long-term consequences. This economic assessment explores cost savings associated with using NOL-guided anesthesia to optimize postoperative pain treatment. By categorizing postoperative pain scores and extrapolating outcomes, the study demonstrates potential cost reductions in pain-related readmissions, emergency room visits, and opioid prescriptions. Implementing NOL monitoring could lead to substantial savings per patient and improve overall postoperative pain management.
Download Presentation

Please find below an Image/Link to download the presentation.
The content on the website is provided AS IS for your information and personal use only. It may not be sold, licensed, or shared on other websites without obtaining consent from the author.If you encounter any issues during the download, it is possible that the publisher has removed the file from their server.
You are allowed to download the files provided on this website for personal or commercial use, subject to the condition that they are used lawfully. All files are the property of their respective owners.
The content on the website is provided AS IS for your information and personal use only. It may not be sold, licensed, or shared on other websites without obtaining consent from the author.
E N D
Presentation Transcript
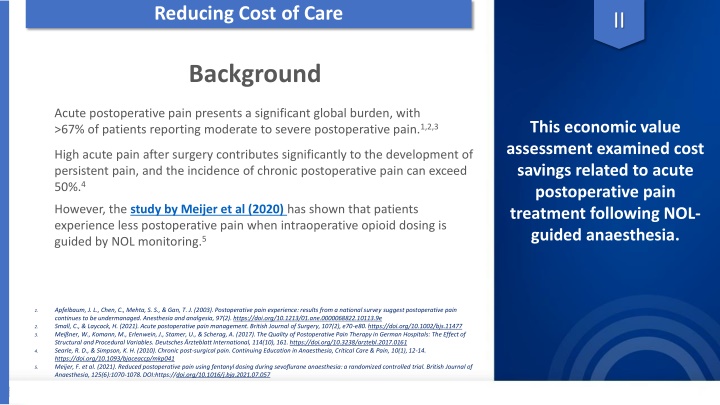
Reducing Cost of Care II Background Acute postoperative pain presents a significant global burden, with >67% of patients reporting moderate to severe postoperative pain.1,2,3 This economic value assessment examined cost savings related to acute postoperative pain treatment following NOL- guided anaesthesia. High acute pain after surgery contributes significantly to the development of persistent pain, and the incidence of chronic postoperative pain can exceed 50%.4 However, the study by Meijer et al (2020) has shown that patients experience less postoperative pain when intraoperative opioid dosing is guided by NOL monitoring.5 Apfelbaum, J. L., Chen, C., Mehta, S. S., & Gan, T. J. (2003). Postoperative pain experience: results from a national survey suggest postoperative pain continues to be undermanaged. Anesthesia and analgesia, 97(2). https://doi.org/10.1213/01.ane.0000068822.10113.9e Small, C., & Laycock, H. (2021). Acute postoperative pain management. British Journal of Surgery, 107(2), e70-e80. https://doi.org/10.1002/bjs.11477 Mei ner, W., Komann, M., Erlenwein, J., Stamer, U., & Scherag, A. (2017). The Quality of Postoperative Pain Therapy in German Hospitals: The Effect of Structural and Procedural Variables. Deutsches rzteblatt International, 114(10), 161. https://doi.org/10.3238/arztebl.2017.0161 Searle, R. D., & Simpson, K. H. (2010). Chronic post-surgical pain. Continuing Education in Anaesthesia, Critical Care & Pain, 10(1), 12-14. https://doi.org/10.1093/bjaceaccp/mkp041 Meijer, F. et al. (2021). Reduced postoperative pain using fentanyl dosing during sevoflurane anaesthesia: a randomized controlled trial. British Journal of Anaesthesia, 125(6):1070-1078. DOI:https://doi.org/10.1016/j.bja.2021.07.057 1. 2. 3. 4. 5.
II Categorizing the RCT Postoperative Pain Scores Method: In the study by Meijer et al (2020), postoperative pain scores up to 90 minutes in the PACU were categorized as either mild (<4), moderate (4 7) or severe (>7). Based on this categorization, and average postoperative pain score trajectories (between surgery and discharge) we explored the potential for postoperative cost savings by NOL. NOL cost savings (average per patient) $83 Acute postoperative pain treatment Based on this categorization the NOL cost savings expected on average per patient is 83$* (comparing 100 NOL guided patients to SOC patients) $45 Pain-related readmissions $29 Emergency room visits $6 Subsequent slides detail the cost savings model Opioid prescriptions at discharge $3 *Excluding equipment costs
II Reducing Postoperative Pain Treatment Burden Extrapolating SOLAR Outcomes Method SOLAR postoperative pain scores were categorized as either mild, moderate or severe The number of patients within each category was multiplied by the acute postoperative pain treatment cost for that category1,2 Total expected costs for 100 patients SOC: $6,905 NOL: $2,408 Total expected costs for each category were calculated for 100 patients Savings per patient 45$ 1Secoli et al. 2008, 2Dalton et al. 2000
II Reducing Pain-Related Readmissions, ER Room Visits and Opioid Prescriptions Extrapolating SOLAR Outcomes Method SOLAR postoperative pain scores were matched to Hernandez-Boussard et al. pain trajectory3 The number of patients assigned to each trajectory was multiplied for: Probability and cost of Pain- related readmission ($14,400)4 Probability and cost of an emergency room visit ($1,389)5 Total expected costs for 100 patients SOC: $17,395 NOL: $14,515 29$ SOC: $11,545 NOL: $10,968 6$ SOC: $4,135 NOL : $3,882 3$ Proportion of patients, and cost of receiving an opioid prescription at discharge ($68)6 Total expected costs were calculated for 100 patients Savings per patient 3 Hernandez-Boussard et al. 2017 4Bailey et al. 2019 5Alltucker 2019 6Aroke et al. 2018
