Comparison of NRTI combinations
Study comparing D/C/F/TAF and D/C + F/TDF combinations in AMBER trial for HIV treatment outcomes at W48, including virologic results and baseline strata analysis.

Download Presentation

Please find below an Image/Link to download the presentation.
The content on the website is provided AS IS for your information and personal use only. It may not be sold, licensed, or shared on other websites without obtaining consent from the author.If you encounter any issues during the download, it is possible that the publisher has removed the file from their server.
You are allowed to download the files provided on this website for personal or commercial use, subject to the condition that they are used lawfully. All files are the property of their respective owners.
The content on the website is provided AS IS for your information and personal use only. It may not be sold, licensed, or shared on other websites without obtaining consent from the author.
E N D
Presentation Transcript
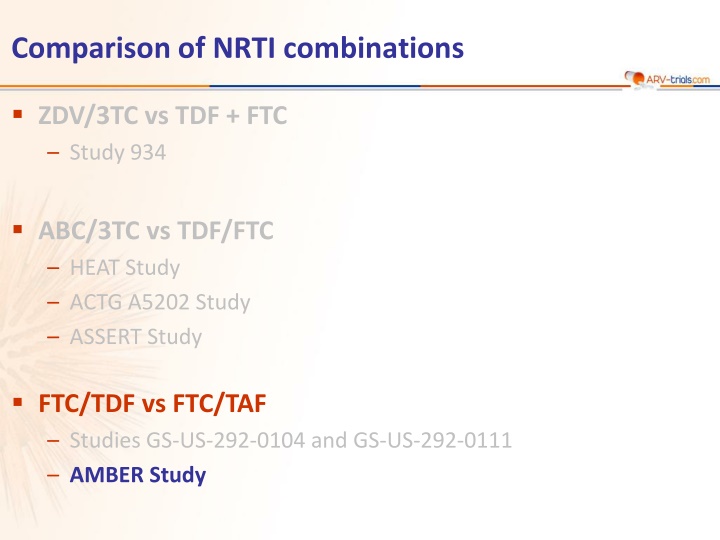
Comparison of NRTI combinations ZDV/3TC vs TDF + FTC Study 934 ABC/3TC vs TDF/FTC HEAT Study ACTG A5202 Study ASSERT Study FTC/TDF vs FTC/TAF Studies GS-US-292-0104 and GS-US-292-0111 AMBER Study
AMBER Study: D/C/F/TAF QD vs D/C + F/TDF QD Design Randomisation* 1:1 Double-blind W48 W96 D/C/F/TAF QD N = 362 D/C/F/TAF QD HIV+ Adults ARV-na ve HIV RNA > 1 000 c/mL CD4 cell count > 50/mm3 eGFR > 50 mL/min D/C + F/TDF placebo D/C + F/TDF QD N = 363 D/C/F/TAF QD D/C/F/TAF placebo * Randomisation was stratified by HIV RNA (< or 100 000 c/mL) and CD4 cell count (< or 200/mm3) Objective Non inferiority of E/C/F/TAF at W48: % HIV RNA < 50 c/mL by intention to treat, snapshot analysis (lower margin of the 95% CI for the difference = -10%) Eron J, EACS 2017, Abs. PS8/2 AMBER
AMBER Study: D/C/F/TAF QD vs D/C + F/TDF QD Baseline characteristics and patient disposition D/C/F/TAF N = 362 D/C + F/TDF N = 363 Median age, years Female, % HIV RNA (log10 c/mL), median HIV RNA > 100 000 c/mL, % CD4 cell count (/mm3), median CD4 < 200 per mm3, % eGFR (Cockroft-Gault), mL/min, median Discontinuation by W48, N (%) For adverse event, N Lost to follow-up / Withdrew consent, N Physician decision Non-compliance, N Death, N Other reasons, N 34 12.2 4.4 16.6 461.5 6.1 119 23 (6.4) 8 5 / 4 3 1 0 2 34 11.3 4.6 19.3 440 8 118 28 (7.7) 15 5 / 6 0 0 1 (follow-up phase) 1 Eron J, EACS 2017, Abs. PS8/2 AMBER
66 AMBER Study: D/C/F/TAF QD vs D/C + F/TDF QD Virologic outcome at W48 (ITT, snapshot) % 100 91.4 D/C/F/TAF (N = 362) D/C + F/TDF (N = 363) Adjusted difference, % (95% CI) 88.4 80 Favours D/C + F/TDF Favours D/C/F/TAF 60 40 2.7 - 1.6 7.1 20 8.3 4.4 4.1 3.3 0 HIV RNA < 50 c/mL HIV RNA 50 c/mL No data -10 -8 -6 -4 -2 0 2 4 6 8 10 Resistance analysis Virologic failures with paired genotypes (baseline and failure with HIV RNA 400 c/mL), N = 9 [7 D/C/F/TAF + 2 D/C + F + TDF]: 1 patient with emergence of M184I/V (D/C/F/TAF) Eron J, EACS 2017, Abs. PS8/2 AMBER
66 AMBER Study: D/C/F/TAF QD vs D/C + F/TDF QD Virologic outcome at W48 by baseline strata (ITT, snapshot) D/C/F/TAF (N = 362) D/C + F/TDF (N = 363) % 100 92.6 91.7 90.4 88.6 89.8 86.2 80.0 80 72.7 60 40 20 N 303 293 59 70 340 334 22 29 0 HIV RNA 100 000 c/mL HIV RNA > 100 000 c/mL CD4 200/mm3 CD4 < 200/mm3 Difference (95% CI) 1.3 (-3.4 to 6.1) 9.8 (- 3.3 to 22.5) 4 (- 0.4 to 8.6) - 13.5 (- 37.8 to 9.6) Eron J, EACS 2017, Abs. PS8/2 AMBER
AMBER Study: D/C/F/TAF QD vs D/C + F/TDF QD Mean (SE) change from baseline in eGFR (mL/min/1.73m2) based on serum creatinine and CKD-EPI formula based on serum cystatin and CKD-EPI formula D/C + F/TDF (N = 329) D/C/F/TAF (N = 340) D/C + F/TDF (N = 330) D/C/F/TAF (N = 337) 8 8 ** 4 4 0 0 -4 -4 * -8 -8 -12 -12 0 4 8 12 16 20 24 28 32 36 40 44 48 0 4 8 12 16 20 24 28 32 36 40 44 48 Weeks Weeks * p < 0.0001 ** p = 0.0001 Eron J, EACS 2017, Abs. PS8/2 AMBER
AMBER Study: D/C/F/TAF QD vs D/C + F/TDF QD Mean (SE) changes (mg/g) in proteinuria at W48 D/C/F/TAF D/C + F/TDF Urinary protein: creatinine Urinary albumin: creatinine BL 11.38 (1.57) 17.92 (5.07) BL 66.23 (3.66) 77.67 (6.51) 10 5 0 -10 -5 -0.58 -2.45 -10.34 -20 -10 p = 0.003 -30 -22.42 -25 -40 p = 0.033 -2-microglobulin: creatinine Retinol binding protein: creatinine p < 0.0001 p < 0.0001 1 500 600 401.12 837.63 400 500 200 16.84 -100.58 -500 0 BL 110.66 (7.12) 186.73 (74.66) BL 248.45 (40.36) 379.54 (176.11) Eron J, EACS 2017, Abs. PS8/2 AMBER
AMBER Study: D/C/F/TAF QD vs D/C + F/TDF QD Mean (SE) % changes in bone mineral density at W48 Spine Hip D/C/F/TAF (N = 96) D/C + F/TDF (N = 85) D/C/F/TAF (N = 96) D/C + F/TDF (N = 85) p < 0.0001 p < 0.0001 p < 0.0001 p = 0.00* 2 2 1 1 0.3 0.2 0 0 -1 -2 -3 -4 -1 -2 -3 -4 -1.3 -1.7 -2.7 -3.4 0 24 48 0 24 48 Weeks Weeks D/C/F/TAF D/C + F/TDF D/C/F/TAF D/C + F/TDF 27.1% 41.2% 12.5% 44.7% 3% decrease 12.5% 4.7% 12.5% 2.4% 3% increase Eron J, EACS 2017, Abs. PS8/2 AMBER
AMBER Study: D/C/F/TAF QD vs D/C + F/TDF QD Median lipid values (mg/dL) TC:HDL-C ratio D/C/F/TAF baseline D/C/F/TAF W48 D/C + F/TDF baseline D/C + F/TDF W48 250 196 3.84.03.83.9 200 4 162172 163 150 3 123 116 112 97101 97 96 95 100 2 4248 42 44 1 50 0 0 Total LDL-C HDL-C Triglycerides TC:HDL-C ratio cholesterol Eron J, EACS 2017, Abs. PS8/2 AMBER
AMBER Study: D/C/F/TAF QD vs D/C + F/TDF QD Adverse events through W48, % D/C/F/TAF N = 362 5.2 4.7 1.9 * 0 34.8 8.6 6.1 5.5 19.6 D/C + F/TDF N = 363 6.1 5.8 4.4 ** 0 41.6 11.0 3.9 9.9 18.2 Grade 3-4 adverse event Serious adverse event Discontinuation due to adverse event Death Adverse event possibly related to study drug Diarrhea Rash Nausea Diarrhea, any grade * rash (N = 6); diarrhea (N = 1) ** rash/erythema (N = 7), diarrhea (N = 1), toxic skin eruption (N = 2), Stevens Johnson syndrome (N = 1), bone marrow oedema (N = 1), increased beta-2 macroglobulin (N = 1), arthralgia (N = 1), neoplasm (N = 2) No grade 3 or 4 laboratory abnormalities in 5% of patients in either arm No discontinuation of D/C/F/TAF for bone, renal or CNS adverse event Eron J, EACS 2017, Abs. PS8/2 AMBER
AMBER Study: D/C/F/TAF QD vs D/C + F/TDF QD Conclusion Through Week 48, D/C/F/TAF resulted in high virologic suppression in treatment-na ve patients (91.4% ; FDA Snapshot) that was non-inferior to DRV/C + F/TDF (88.4%) No development of DRV, primary PI or TDF/TAF RAMs One patient developed M184I/V (D/C/F/TAF arm) Few serious adverse events, grade 3/4 adverse events, or adverse events- related discontinuations No discontinuations due to bone, renal, or CNS adverse events Bone, renal and lipid safety consistent with known profiles of TAF and cobicistat Eron J, EACS 2017, Abs. PS8/2 AMBER