Climate Risk Stress Testing in Malaysia's Banking System by Dr. Lim Kok Tiong
Dr. Lim Kok Tiong presents a detailed case study on Climate Risk Stress Testing in Malaysia's banking system, assessing the financial impacts of physical and transition climate risks. The study highlights the implications on loan portfolios and expected credit losses, emphasizing the need for proactive measures to address climate-related financial risks.
Download Presentation

Please find below an Image/Link to download the presentation.
The content on the website is provided AS IS for your information and personal use only. It may not be sold, licensed, or shared on other websites without obtaining consent from the author.If you encounter any issues during the download, it is possible that the publisher has removed the file from their server.
You are allowed to download the files provided on this website for personal or commercial use, subject to the condition that they are used lawfully. All files are the property of their respective owners.
The content on the website is provided AS IS for your information and personal use only. It may not be sold, licensed, or shared on other websites without obtaining consent from the author.
E N D
Presentation Transcript
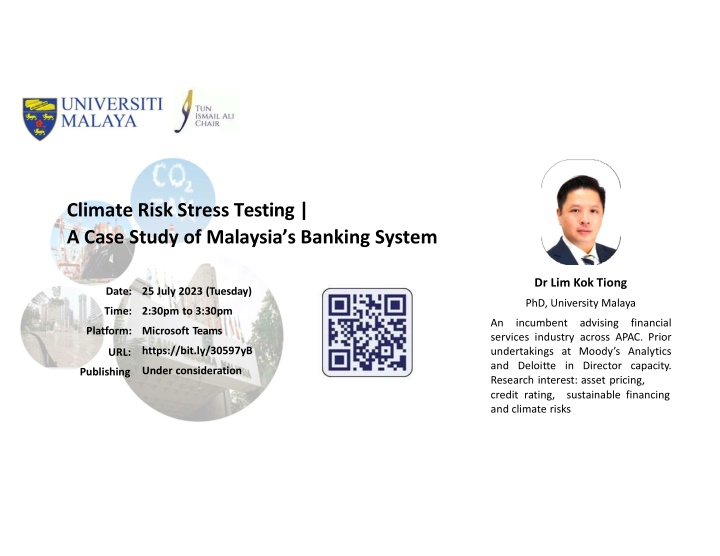
Climate Risk Stress Testing | A Case Study of Malaysia s Banking System Dr Lim Kok Tiong Date: 25 July 2023 (Tuesday) PhD, University Malaya Time: 2:30pm to 3:30pm An services industry across APAC. Prior undertakings at Moody s Analytics and Deloitte in Director capacity. Research interest: asset pricing, credit rating, sustainable financing and climate risks incumbent advising financial Platform: Microsoft Teams https://bit.ly/30597yB URL: Under consideration Publishing
Abstract ResearchMotivations: Net ZeroEmissions(NZE) mandate Networkfor GreeningFinancialSystem (NGFS) 2024 Climate Risk Stress Testing(CRST) Consultative Paper (Hot House World) Bank Negara Malaysia Climate related financialrisks Basel Committeeon Bank Supervision (BCBS) Aim: To assess the financial impacts posed by the physical and transition climate risks on Malaysia s bankingsystem Findings: Flooding(Physical) Loansportfolioto contract by 0.4 to 2% & ECL to expandby 6.3 to 22.5% Export Shock (Transition) Loans portfolio to contract by 2 to 3% & ECL to expand by 25.4 to 135% Carbon Premium (Transition) Loans portfolio to contract by approx. 6.4% & ECL to expand by approx.19.2%
Abstract(Continued) PolicyRecommendation: Carbon premium on Loans and Advances as policy tool for the BNM to champion the NZE mandate
Agenda Background Literature Review Data & Methodology Results & Discussion Conclusion
Background Net Zero Emissions(NZE)mandate Growingintensityfor banks to carry out concrete actions in meeting the NZE mandate Malaysiais a member NetworkforGreening Financial System (NGFS) Clearinitiativefrom BNM on the 2024 ClimateRisk Stress Testing(CRST) ConsultativePaper Potential Physical and TransitionClimateRisks 2021 floodingeventin Malaysia estimatedto be aroundMYR6 billion indamages 15x the average damagein 20 years Pressure is growingfor Malaysia to impose the carbontaxationon CO2emissions Singapore & Japan chargingUSD5 per mtCO2e Potential export ban on product associated with high CO2 emissions Europe ban palm oil import onthe groundof deforestation.
Background(Continued) ResearchObjectives: This paper aims to extrapolate the financial impacts posed by physical and transition climate risks onMalaysia bankingsystem The research approach and outcomes would contribute as one of the earliest references in the contextof the climate risk stress testing(CRST),the emergingsubject.
LiteratureReview A totalof 52 pieces of literaturecited in this paper Majority are current literatureand couldbe groupedintothreecategories: ClimateRisk Scenario& Framework e.g., NGFS-FSB(2022) BCBS(2021b) BNM (2022) ECB(2022) ClimateChange: e.g., Nordhaus(2017) Budolfson et al. (2017) Dietz et al. (2021) Parry, Black, and Zhunussova (2022) ClimateRisk Impact on Banks: e.g., Cantelmo, Melinna, and Papageorgiou (2019) Faiella and Lavecchia (2020) Belloni, Kuik, and Mingarelli (2022) Takahashi and Shino (2023) Research Framework, Climate Risk Scenarios, Data, and Methodology
ResearchFramework This paper aims to extrapolate the financial impacts posed by physical and transition climate risks on Malaysia bankingsystemusingthe BCBS frameworkas the guide. Figure 5: EmpiricalFramework Note:Thisdiagramis reproducedfrom Figure1 in page 4 (BCBS 2021b)
Hypotheses: Climate Risk Scenarios Three climate risk scenarios are Flooding (physical climate risk), Export Shock (transition climate risk) and CarbonPremium (transition climate risk): Scenario1: Flooding Reference: 2021 Flooding Event Cantelmo, Melinna, and Papageorgiou (2019) Scenario2: Export Shock Reference: EU Deforestation Ban US Forced Labour Ban Department of Statistics Malaysia Scenario3: Carbon Premium Reference: Singapore USD5/mtCO2e Japan USD5/mtCO2e Parry,Black, and Zhunussova (2022) Transmitted through: GDP at -0.5% Unemployment Rate at +0.5% Transmitted through: GDP at -2% Unemployment Rate at +3% Transmitted through: Overnight Policy Rate at 0.4% Impact on Banks Loans and Advances and Expected Credit Loss Exposure *All three scenarios are deliberated through cross-referencing pertinent literature, historical records from Department of Statistics Malaysia (DSOM) and Bank Negara Malaysia (BNM), and climate policies implemented by countries in the region.
Hypotheses: Climate Risk Scenarios (Continued) Note: Reproduced from (Parry, Black, and Zhunussova 2022),Figure 2 in page 2
Hypotheses: Climate Risk Scenarios (Continued) Malaysia Employmentby Sectorin 2021 MYR 'Mil Import 76,637 232,681 33,308 474,024 15,799 78,294 24,604 26,459 25,539 987,344 Year 2021 Europea Asean Middle East North& SouthAsia Africa NorthAmericab CentralSouthAmerica Oceania Others Total Note: Statistics are sourced Department of Statistics Malaysia (dosm.gov.my). a = The EU Deforestation- Free Products Regulation has direct effect on palm oil export due to deforestation claims. b = The US Customs and Border Protection Agency has banned import of palm oil and gloves due to forced labour claims Export 103,721 343,503 25,696 489,322 30,405 148,603 25,254 41,654 32,865 1,241,022 Trade Balance 27,084 110,822 - 7,612 15,298 14,605 70,309 650 15,196 7,326 253,678 Agriculture 12% Miningand quarrying 1% Manufacturing 17% Services 61% Construction 9% Note: The pie chart is illustrated using data sourced from Department of StatisticsMalaysia (dosm.gov.my)
Data Dependent Variables: Loans & Advances (LG) and Expected Credit Loss (ECL) are gathered from 19 banks annualreportsspanningfrom2012 to 2021. Independent Variables: ROE is sourced from banks annual reports, and the GDP, HPI, INF, OPR and UR are sourced from the DOSM and the BNM PreliminaryDataAnalyses are performed: Unit Root Test: - results show that the ECL contains unit root but with first difference, it is stationary Panel Cointegration Test: - results show that independent variables have long-term relation withthe dependent variables Correlation Analysis:- result showsthat independentvariables are highlycorrelated
Data(Continued) List of Banks Affin BankL Public BankL Bank of China HSBC Bank RakyatL RHBL Al Rajhi JP Morgan AmbankL CIMBL MaybankL SCB Bangkok Bank Deutsche Bank Nova Scotia UOB Hong Leong BankL Bank of America OCBC Note: Countries tagged with superscript L denotes local banks else foreign banks operating in Malaysia
Data(Continued) DescriptiveStatistics Independent Dependent LG 0.07 0.04 1.83 -0.50 0.25 190 ECL 0.16 0.02 9.18 -0.85 0.76 190 ROE 8.61 8.76 24.10 -9.56 5.20 190 GDP 3.83 4.75 6.00 -5.50 3.23 190 HPI 6.29 6.80 13.40 1.20 4.06 190 INF 1.78 2.10 3.70 -1.20 1.32 190 OPR 2.79 3.00 3.25 1.75 0.53 190 UR 3.46 3.30 4.60 2.90 0.57 190 Mean Median Maximum Minimum Std. Dev. Observation Note: LG = Loan Growth Rate, ECL = Expected Credit Loss Growth Rate, GDP = GDP Growth Rate, HPI = Housing Price Index, INF = Inflation, OPR= Overnight Policy Rate, ROE = Return on Equity, and UR = Unemployment Rate.
Methodology Sensitivity Analyses:Forward Orthogonal Transformation of Generalized Method of Moments (FOD-GMM) GMM is a proven econometric method on financial related research (e.g., Athanasoglou, Brissimis, and Delis 2008, Caby, Ziane, and Lamarque 2022, Dietrich and GabrielleWanzenried2014,Teixeiraet al. 2020 GMM addresses the endogeneity issue - lagged dependent variable as one of the explanatoryvariables FOD method is chosen over First Difference (FD) because it proven to have higher efficiency (e.g., Hayakawa (2009), Phillips(2019), Hsiaoand Zhou(2017))
Methodology (Continued) ModelSpecification: ?it= ??it 1+ ??it+ ??it+ ??i+ ?it where ?itis the dependent variable (e.g., LG or ECL) of bank ? at time ?, ?it 1denotes the endogenous variable, ?itdenotes the ROE, ECL and LG variables, ?itdenotes the vector of macroeconomic variables: GDP Growth Rate (GDP), Housing Price Index (HPI), Inflation (INF), Overnight Policy Rate (OPR) and Unemployment Rate (UR), ?iis an unobserved time-invariant effect, and ?itdenotes the error terms. The parameters are denoted by ?, ?, ?, and ?. In particular, the ? is the parameter of interest to assess the impacts of the three climate risk scenarios
Methodology (Continued) Assessment& Robustness Validation A series of 40 regression models is performed with the combination of control variables (?it) Sargan test is used to validate each model (e.g., Arellano and Bond (1991), Arellano and Bover(1995), Roodman(2006)) Signs and significance levels of estimated parameters from validated models are assessed for robustness ClimateRisk Impact Extrapolation The impact of each deliberated climate risk scenario on banks loans & advances (LG) and expected credit loss exposure (ECL) are transmitted through robust parameters of the designatedtransmitters
Methodology (Continued) Scenario Climate Risk Category and Risk Specific Risk Transmitters Expected Correlation Outputs 1 Physical Risk - Flood GDP Growth Rate (GDP) Positive Loan Growth Rate (LG) Negative ECL Growth Rate (ECL) Unemployment Rate (UR) Negative Loan Growth Rate (LG) Positive ECL Growth Rate (ECL) 2 Transition Risk - Export Shocks GDP Growth Rate (GDP) Positive Loan Growth Rate (LG) Negative ECL Growth Rate (ECL) Unemployment Rate (UR) Negative Loan Growth Rate (LG) Positive ECL Growth Rate (ECL) 3 Transition Risk - Carbon Premium Overnight Policy Rate (OPR) Positive Loan Growth Rate (LG) Positive ECL Growth Rate (ECL) Note: see Section 3 for more details.
Empirical Results(Continued) Key Takeaways fromthe MacroeconomicVariables Sensitivity Analyses Macroeconomyvariables InfluenceonLG Influenceon ECL FullSample FullSample GDP* Yes Robust Yes Robust HPI Yes- Robust Yes Robust INF No NotRobust No NotRobust LaggedINF No NotRobust No NotRobust OPR Yes Robust No Effect on ECL is lagged LaggedOPR* No NotRobust Yes Robust UR* Yes Robust Yes Robust LaggedUR Yes Robust No NotRobust Note: Macroeconomy variables tagged with * are selected climate risk transmitters
Empirical Results(Continued) Extrapolation financial impacts posed physical & transition climate risks on Malaysia s banking system Impact on Banks Loans and Advances Impact on Banks Expected CreditLoss Exposure Scenario 1: Flooding GDP @ -0.5% +0.7% -0.35% Scenario 1: Flooding GDP @ -0.5% -12.7% +6.35% Transmitters Multiplier Outcome Note: The GDP multiplier is an average derived from Models 1 and 11 in Table 9, the UR multiplier is an average derived from Models 7,17 and 27 in Table 9, the OPR multiplier is a net average derived from the OPR and lagged OPR in Table 9. UR @ +0.5% -4.0% -2% OPR @ N/A - - Transmitters Multiplier Outcome Note: The GDP multiplier is an average derived from Models 1, 11, 21 and 31 in Table 11, the UR multiplier is an average derived from Models 7,17, 27 and 37 in Table11, the OPR multiplier is an average derived from Models 6, 16, 26 and 36 in Table 11. UR @ +0.5% +45.0% +22.5% OPR @ N/A - -
Empirical Results(Continued) Extrapolation financial impacts posed physical & transition climate risks on Malaysia s banking system Impact on Banks Expected CreditLoss Exposure Impact on Banks Loans and Advances Scenario 2: Export Shock GDP @ -2% +0.7% -1.4% Scenario 2: Export Shock GDP @ -2% -12.7% +25.4% Transmitters Multiplier Outcome Note: The GDP multiplier is an average derived from Models 1 and 11 in Table 9, the UR multiplier is an average derived from Models 7,17 and 27 in Table 9, the OPR multiplier is a net average derived from the OPR and lagged OPR in Table 9. UR @ +3% -4.0% -12% OPR @ N/A - - Transmitters Multiplier Outcome Note: The GDP multiplier is an average derived from Models 1, 11, 21 and 31 in Table 11, the UR multiplier is an average derived from Models 7,17, 27 and 37 in Table11, the OPR multiplier is an average derived from Models 6, 16, 26 and 36 in Table 11. UR @ +3% +45.0% +135% OPR @ N/A - -
Empirical Results(Continued) Extrapolation financial impacts posed physical & transition climate risks on Malaysia s banking system Impact on Banks Loans and Advances Impact on Banks Expected CreditLoss Exposure Scenario 3: Carbon Premium GDP @ N/A - - Scenario 3: Carbon Premium GDP @ N/A - - Transmitters Multiplier Outcome Note: The GDP multiplier is an average derived from Models 1 and 11 in Table 9, the UR multiplier is an average derived from Models 7,17 and 27 in Table 9, the OPR multiplier is a net average derived from the OPR and lagged OPR in Table 9. UR @ N/A - - OPR @ +0.4% +16% 6.4% Transmitters Multiplier Outcome Note: The GDP multiplier is an average derived from Models 1, 11, 21 and 31 in Table 11, the UR multiplier is an average derived from Models 7,17, 27 and 37 in Table11, the OPR multiplier is an average derived from Models 6, 16, 26 and 36 in Table 11. UR @ N/A - - OPR @ +0.4% +48% +19.2%
Conclusion While Malaysia may be in the non-disaster-prone-country category, the impacts posed by physical and transition climaterisks are significance. Amongstthe three examinedclimate risk scenarios: Financial impact posed by Export Shock scenario is severe on Malaysia s banking system 10% impact on export to the US and Europe is simulated through GDP and UR Recurrence of 2021 flooding is simulated through GDP and UR USD5/mtCO2e is simulated through carbon premium
Conclusion (Continued) Policyrecommendation: USD5/mtCO2e is simulated through carbon premium Carbon Premium Carbon Credit Carbon Tax Carbon premium on loans and advances to brown sectors. This is a critical climate risk tool for BNM and within its jurisdiction to charter the pathway for banks to meet the NZE mandate by 2050 ETF on Carbon Allowance through Voluntary Carbon Market (VCM) platform regulated by Securities Commission (SC) Being mooted for implementation potentially a joint jurisdictions: Lembaga Hasil Dalam Negeri (LHDN) and Department of Environment (DOE)
Conclusion (Continued) CarbonPremiumRationales: To sustain brown sectors with continue financing to minimize impact on employment market and the 60% household segment As agentof change brownsectors may sunsetgraduallydueto higherborrowingcost Proceeds from carbon premiums would be a sizeable private fund (approx. MYR3- 4billion/year from non-household segment) to develop the green sector and a plus to ETF VCM platform. Through carbon premium, banks are able to contribute constructively in sustaining existing economyand developingthe green sector, Throughcarbon premium, brownsectors also contributingin the green sectordevelopment Within the BNM jurisdiction, BNM can determine the concerted premium rate and target sector (e.g., export sensitive sectors) in achieving the NZE mandate while ensuring the core mandateon price stability beingin tact.
Climate Risk Stress Testing | A Case Study of Malaysia s Banking System Thank You
