Childhood Obesity and Activity Levels in London and England
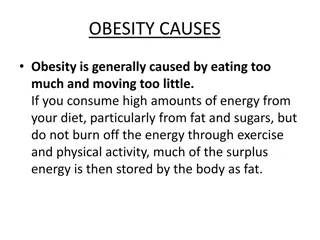
Rates of childhood obesity in London have increased significantly, with higher proportions of 4-5 year olds and secondary school children being overweight or obese. Furthermore, a low percentage of children in England achieve the recommended levels of physical activity. Factors such as environmental and behavioral influences contribute to this concerning trend. Additionally, a declining trend in the number of UK primary school children walking to school is observed.

Download Presentation

Please find below an Image/Link to download the presentation.
The content on the website is provided AS IS for your information and personal use only. It may not be sold, licensed, or shared on other websites without obtaining consent from the author.If you encounter any issues during the download, it is possible that the publisher has removed the file from their server.
You are allowed to download the files provided on this website for personal or commercial use, subject to the condition that they are used lawfully. All files are the property of their respective owners.
The content on the website is provided AS IS for your information and personal use only. It may not be sold, licensed, or shared on other websites without obtaining consent from the author.
E N D
Presentation Transcript
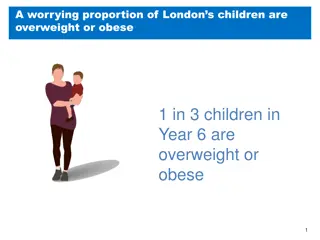
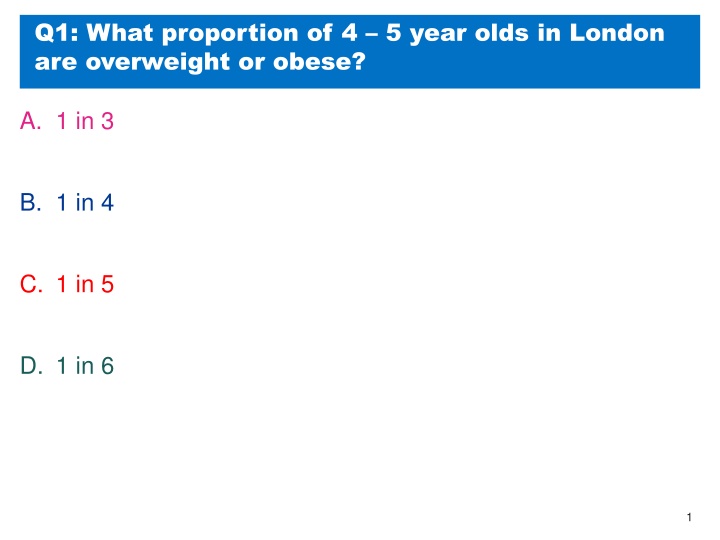
Q1: What proportion of 4 5 year olds in London are overweight or obese? A. 1 in 3 B. 1 in 4 C. 1 in 5 D. 1 in 6 1
Q1: What proportion of 4 5 year olds in London are overweight or obese? A. 1 in 3 B. 1 in 4 C. 1 in 5 D. 1 in 6 Rates of childhood obesity have increased considerably in recent years, and London now has higher rates of childhood obesity than other similar global cities. Genetic causes of childhood obesity are rare, and experts agree that this increase in childhood obesity is due to environmental and behavioural factors. 2
Q2: What proportion of children in London are overweight or obese when they start secondary school (age 10 11)? A. 2 in 5 B. 3 in 5 C. 1 in 2 D. 2 in 3 3
Q2: What proportion of children in London are overweight or obese when they start secondary school (age 10 11)? A. 2 in 5 B. 3 in 5 C. 1 in 2 D. 2 in 3 Children who are overweight or obese are more likely than those who are a healthy weight to go on to become obese adults. Childhood obesity is also associated with type 2 diabetes, asthma, some cancers, skin infections, low self esteem and anxiety. 4
Q3: What percentage of children in England achieve the recommended activity levels? A. 9% B. 12% C. 20% D. 28% 5
Q3: What percentage of children in England achieve the recommended activity levels? A. 9% B. 12% C. 20% D. 28% The NHS recommends that children and young people between the ages of 5 and 18 should do 60 minutes of physical activity a day. This should range from moderate activity (e.g. cycling or playground activities) to vigorous activity (e.g. running or tennis). 6
Q4: In 2012, what percentage of UK primary school children walked to school? A. 20% B. 35% C. 47% D. 58% 7
Q4: In 2012, what percentage of UK primary school children walked to school? A. 20% B. 35% C. 47% D. 58% This had fallen since 1997, when 53% of primary school children walked to school. In contrast, in 1971, 80% of 7 to 8 year olds walked to school independently. 8
Q5: On average, how much more sugar than is recommended do 11 to 18 year-olds consume each day? A. Twice as much B. Three times as much C. Four times as much D. Five times as much 9
Q5: On average, how much more sugar than is recommended do 11 to 18 year-olds consume each day? A. Twice as much B. Three times as much C. Four times as much D. Five times as much Sugar sweetened drinks, for example fizzy drinks, juice drinks, cordials and squashes are the main source of this extra sugar. 10
Q6: How many hours a day does the average child in England spend in front of a screen? A. Two B. Five C. Six D. Eight 11
Q6: How many hours a day does the average child in England spend in front of a screen? A. Two B. Five C. Six D. Eight In contrast, in 1995 the average child spent 3 hours a day in front of a screen. More hours in front a screen means that there is less time in which children are being active. It has also been shown that watching TV increases cravings for food and energy intake in children and that if children eat or drink while watching TV they consume more calories. 12
Q7: What proportion of Newham teenagers eat fast food every day? A. 5% B. 12% C. 21% D. 35% 13
Q7: What proportion of Newham teenagers eat fast food every day? A. 5% B. 12% C. 21% D. 35% 38% eat fast food at least once a week. 14
Q8: What percentage of an adults recommended daily calories are in the average chicken shop meal of chicken, chips and a drink? A. 25% B. 46% C. 59% D. 70% 15
Q8: What percentage of an adults recommended daily calories are in the average chicken shop meal of chicken, chips and a drink? A. 25% B. 46% C. 59% D. 70% Typically, this meal would also contain more than half your daily salt, and half your daily fat. 16
Q8: What is the most common reason for 5 9 years olds being admitted to hospital? A. Tooth decay B. Asthma C. Diabetes D. Cancer 17
Q8: What is the most common reason for 5 9 years olds being admitted to hospital? A. Tooth decay B. Asthma C. Diabetes D. Cancer In 2013, a third of five year-olds and almost half of eight year-olds had tooth decay. 18
Tie breaker: Roughly how many fried chicken shops are there in London? 19
Tie breaker: Roughly how many fried chicken shops are there in London? 8,000 This means that there is roughly 1 chicken shop for every 1,000 Londoners. And the number is increasing all the time by about 10% every year! 20