Chemistry Concepts and Energy Diagrams Explained
Explore the melting points, heating of substances, and states at different temperatures. Learn about exothermic and endothermic reactions, potential energy diagrams, and factors affecting reaction rates. Speed up reactions by manipulating temperature, concentration, surface area, or adding catalysts.

Download Presentation

Please find below an Image/Link to download the presentation.
The content on the website is provided AS IS for your information and personal use only. It may not be sold, licensed, or shared on other websites without obtaining consent from the author. If you encounter any issues during the download, it is possible that the publisher has removed the file from their server.
You are allowed to download the files provided on this website for personal or commercial use, subject to the condition that they are used lawfully. All files are the property of their respective owners.
The content on the website is provided AS IS for your information and personal use only. It may not be sold, licensed, or shared on other websites without obtaining consent from the author.
E N D
Presentation Transcript
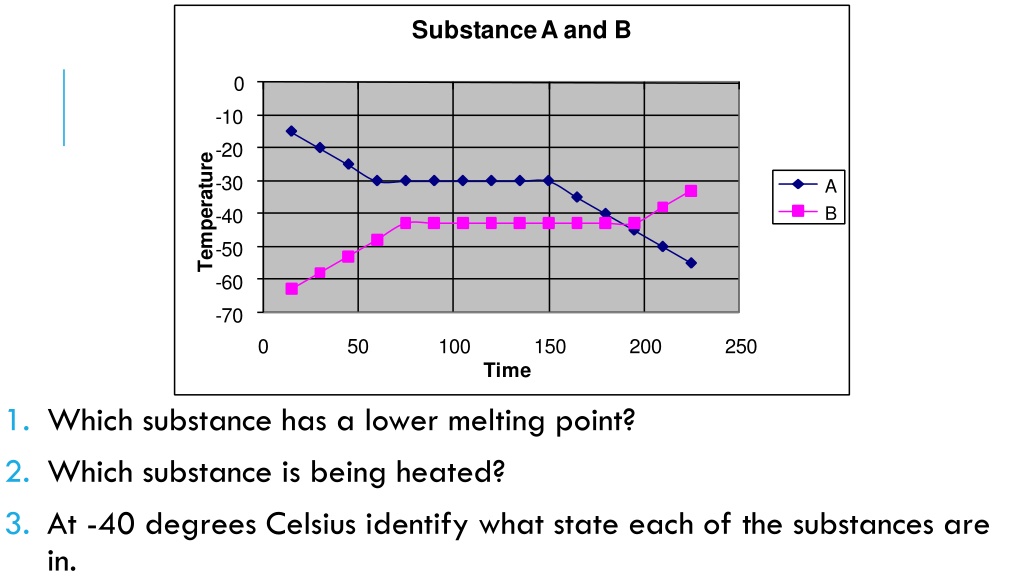
Substance A and B 0 -10 -20 Temperature -30 A B -40 -50 -60 -70 0 50 100 150 200 250 Time 1. Which substance has a lower melting point? 2. Which substance is being heated? 3. At -40 degrees Celsius identify what state each of the substances are in.
CHEMICAL REACTIONS: Reactants Products Reactants: Substances that you start with. Products: Substances that are formed during the reaction.
Exothermic Energy is given off or exiting the system. Endothermic Energy is absorbed or is entering the system.
POTENTIAL ENERGY DIAGRAM A.Reactants B.Products C.Activated Complex: A mess of molecules ready to reorganize/rebond. (max value starting value) 85 0 -42
POTENTIAL ENERGY DIAGRAM D. Activation Energy (EA): Energy needed to break bonds so new ones can form. E. Enthalpy (heat of reaction): energy that is gained or lost during the reaction. (products reactants) 85 0 -42
POTENTIAL ENERGY DIAGRAM Is this graph increasing or decreasing in energy? Decreasing in Energy. Is this exothermic or endothermic? Exothermic 85 0 -42
POTENTIAL ENERGY DIAGRAM Calculating Enthalpy ( H): Products Reactants H = -42 kcal 0 kcal = -42 kcal Reactants Products + Energy Reactants Products + (-42 kcal) 85 0 -42
POTENTIAL ENERGY DIAGRAMS Endothermic Reaction, it is increasing in energy. H = 100 kJ 50 kJ = 50 kJ Reactants + Energy Products Reactants + 50 kJ Products
HOW CAN WE SPEED UP A REACTION? Increasing temperature, increases the rate of reaction. Increasing concentration, increases the rate of reaction. Increasing surface area, increases the rate of reaction. Adding a catalyst can also speed up a reaction by lowering the activation energy.
POTENTIAL ENERGY DIAGRAMS A catalyst lowers the activation energy required to start a reaction, it lowers the hill that the chemicals have to climb.
In the diagram to the left, is the reaction endothermic or exothermic? How much heat energy is absorbed or released in the reaction? How much activation energy is needed for this reaction to occur? If molecules A + B reacted to form C + D, write the chemical equation with the energy in it for this reaction.
EXIT TICKET On a sheet of paper complete the following problem and turn it in to the basket when you leave: Calculate the H of this reaction. 220 180 0