Causal Inference and Scientific Goals
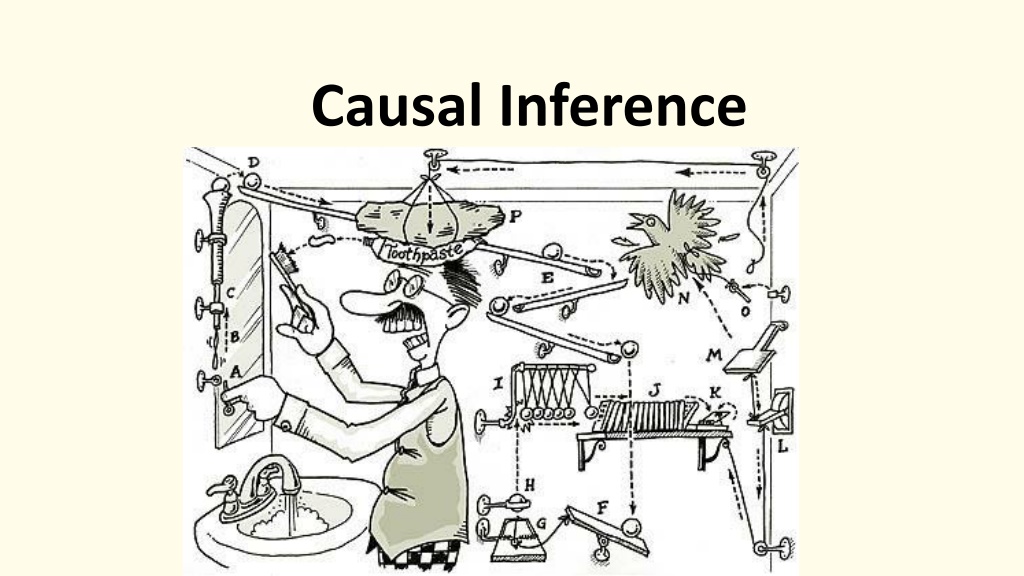
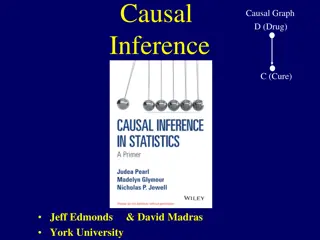
Causal Inference
Goals of Science and Links Between Them
Prediction &
Forecasting
Mechanistic
Understanding
Pattern
Recognition
All are valid and useful in particular contexts – What are
YOU
seeking to
do?
Causal
Understanding
What is your question? Is it
fundamentally causal? Or not?
Do You Need to be Doing Causal Inference?
•
No!
•
Not all studies will provide causal links between different variables of interest
•
If the study goal is predictive or descriptive rather than causal, this might not
be needed
•
But…
•
We cannot hope to understand the world without developing an
understanding of causal associations
•
Indeed
•
Understanding the clockwork machinery of the universe is an end goal of
science – one which we can never achieve, but strive for!
Building an Understanding of Our System
1.
Introduction to Causal Thinking and Potential Outcomes
2.
Causal Diagrams
3.
Using our Causal Diagrams:
•
Conditional Independence
•
Backdoors and Frontdoors
•
Counterfactual Thinking
xkcd
The Classic Example Used to Dissuade us
from Causal Thinking
Church of the Flying Spaghetti Monster
What is Causal Thinking?
Unit
Y
i
Treated
D
i
= 1
Untreated
D
i
=0
POTENTIAL OUTCOMES
Y
1i
Y
0i
Do waves drive biodiversity of invertebrates?
If we Only Observed D
i
= 1, Y
0i
is
Counterfactual
and vice-versa
Unit
Y
i
Treated
D
i
= 1
Untreated
D
i
=0
POTENTIAL OUTCOMES
Y
1i
Y
0i
What we Want to Know: The Potential
Outcomes Framework
ATE = E[Y
1i
- Y
0i
]?
BUT – we CANNOT observe both Y
1i
and Y
0i
Average Treatment Effect
Neyman-Rubin Framework, see Holland 1986 JSA
What We Hope For
ATE = E[Y
1i
– Y
0i
]
= E[Y
1i
] – E[Y
0i
]
= 1
What We Have
ATE = E[Y
1
– Y
0
]
= E [Y
1
] – E[Y
0
]
= 4.5 – 5.25 = -0.75
WAIT, WHAT?!?!?!?!?!?!
Treatment Effects in a Partially Observed
World
Difference in means = ATE +
Selection Bias +
Treatment Heterogeneity Bias
Selection Bias: Unequal Representation
Units from D = 1
Units from D = 0
•
Differences in units between treated and
untreated that create bias
•
Can be that units are different or have
different other external forces influencing
them
•
We get around this with
experimental or
statistical design controls
Treatment Heterogeneity Bias
Units from D = 1
Units from D = 0
Applied Treatment
If we Had Applied Treatment
•
Units in different
treatment groups
responded in
different ways
•
Can adjust for
with experimental
or statistical
design control
What are Our Potential Enemies and Solutions
for Potential Outcomes?
•
We must find ways to parcel out selection bias and treatment
heterogeneity in experiments
•
We must find ways to adjust or control for selection bias and
treatment heterogeneity in observations
•
We must imagine counterfactual outcomes
•
But HOW do we know what to adjust and control for?
Building an Understanding of Our System
1.
Introduction to Causal Thinking
2.
Causal Diagrams
3.
Using our Causal Diagrams:
•
Conditional Independence
•
Backdoors and Frontdoors
•
Counterfactual Thinking
The Core of Causal Inference – what you
want to evaluate
Cause
Effect
In your research, what is your primary cause and effect of interest?
AKA path diagram, AKA DAG
Directed Acyclic Graphs as a Means of
Describing the World
Boxes represent OBSERVED variables
Directed Acyclic Graphs as a Means of
Describing the World
Directed Arrows show flow of causality (information)
Directed Acyclic Graphs as a Means of
Describing the World
x
1
Exogenous variable
= ultimate independent variable, predictor, unexplained
Exogenous Drivers of a System
x
1
y
1
y
2
Endogenous variable
=
Exogenous variable
dependent variable,
response
Endogenous Variables are Inside of a System
Note: You might not be interested in an exogenous variable, or
connection between pairs of variables, but you cannot design a study
without understanding a system.
x
1
y
1
y
2
Endogenous variable
Exogenous variable
Mediators are Endogenous Variables that
Can Also Be Predictors
Endogenous Mediator Variable
=
Endogenous variable that drives other
endogenous variables
Often we are interested in a mediator variable – but we cannot assess its
importance without the exogenous variable
x
1
y
1
y
2
Direct Effect
Direct Effects Have No Mediators
This does not mean there are not other mediators between x1 and y2, but, those
mediators are not influenced by anything else in the system.
x
1
y
1
y
2
Direct Effect
Indirect Effects Flow Through a Mediators
Indirect Effect
If we do not measure y1, we can only assess the
TOTAL EFFECT
of x1 on y2 – which
might be 0, but doesn’t mean there is no causal link!
x
1
y
1
y
2
Unobserved Latent
Variable
Unobserved Variables are Error or Things We
Have Not Measured
e
2
e
1
Unobserved Latent
Variable
e
2
e
1
Everything
else
affecting y1
Everything
else
affecting y2
Note: unless something wild is
going on with error, we often
don’t draw it.
x
1
y
1
y
2
There Can Be Connections Between
Unobserved Variables
x
3
x
2
If we do not consider these, we *can*
produce invalid inferences
x
1
y
1
y
2
You Can Have Multiple Unobserved Variables:
Random v. Systematic Error
x
3
x
2
e
2
e
1
x
4
Knowing the structure of
your system, what you
have, and what you have
not measured is key
Interaction Effects:
Moderators
x
1
x
2
y
1
e
1
x
1
*x
2
OR
x
1
x
2
y
1
Unexplained
correlation
e
1
You Can Have an Uncertain of Unanalyzed
Correlation Between Variables
x
1
x
2
y
1
2
1
Really This Represents a Correlation Between
Unexplained Variances
e
1
d
1
d
1
x
1
x
2
y
1
2
1
Could be Due to a Shared Driver
e
1
d
1
d
1
d
3
x
1
x
2
y
1
2
1
Could Be Due to a Directed Relationship
e
1
d
1
d
1
If correlation is between exogenous variables, we don’t care. If
endogenous, we need to consider *why* as it can affect modeling
choices and experimental design.
Why All of this Worry About Structure of a
Whole System?
y
1
y
2
x
1
Is it possible to assess the causal relationship between y1 and y2 if you
do not know x1? What can you say about any measured relationship
between y1 and y2 if x1 varies, but is unmeasured?
Draw Your System
•
Start with what is the variable you are ultimately interested in.
•
What influences that variable
DIRECTLY?
•
What things influence those variables?
•
Note what you have/can measure and what you cannot.
Building an Understanding of Our System
1.
Introduction to Causal Thinking
2.
Anatomy of Causal Diagrams
3.
Using our Causal Diagrams:
•
Conditional Independence
•
Backdoors and Frontdoors
•
Counterfactual Thinking
What Is It Good For?
•
We can test our intuition by examining
things that do not connect
•
We cannot take apart our system
without imagining what would happen if
something changes.
•
We can begin to understand what we
must grapple with to tease apart the
Gordian knot of Simpson’s Paradox and
confounders
So Let’s Draw a DAG: Where we Start
Invertebrates
Waves
Kelp
Invertebrates
Waves
Algae
But there are Mediators
Kelp
Invertebrates
Waves
Algae
So Waves are Conditionally Independent of
Invertebrates
•
These two relationships are declared to be non-existent
•
This is a
hard causal claim
•
Is it real? How do we assess?
Conditional Independence: The Hard Causal
Claim
•
Conditional indepdence generally excludes non-
linear components (interactions)
x
1
x
2
y
1
y
2
1.
x
1
⏊
y
2
| (y
1
)
2.
x
2
⏊
y
2
| (y
1
)
3.
x
1
* x
2
⏊
y
2
| (y
1
)
Quick Note: Nonlinearities
What claims of conditional independence do
*you* have involving your response of
interest?
(and are they plausible?)
•
Concept from Graph
Theory
•
Two nodes are d-
separated if they are
conditionally
independent
e.g., the
effect of
x
on
y
3
is zero
conditioning on the
influences of
y
1
and
y
2
Conditional Independence (Directed
Separation)
x
⊥
y3 | y1, y2
Kelp
Invertebrates
Waves
Algae
What does Conditional Independence Mean
Here?
Waves
⊥
Inverts | Kelp, Algae
•
Wave -> Invert Analyses CANNOT
include Kelp and Algae
•
It would only show conditional
independence
•
Sampling must cover a wide range of
kelp and algae
•
Otherwise, we would miss the
wave -> invert relationship
Kelp
Invertebrates
Waves
Algae
What does Conditional Independence Mean
Here?
Kelp
⊥
Algae | Waves
•
If you tried to look at the relationship
between kelp and algae, conditioned
on invertebrates, you’d
induce
conditional dependence
•
Any analysis of kelp on algae must
include waves as a conditioning
variable
•
Otherwise, waves would be a
confounding variable
Building an Understanding of Our System
1.
Introduction to Causal Thinking
2.
Anatomy of Causal Diagrams
3.
Using our Causal Diagrams:
•
Conditional Independence
•
Confounding, Backdoors, and Frontdoors
•
Counterfactual Thinking
Kelp
Invertebrates
Waves
Algae
Confounding Variables
Kelp
⊥
Algae | Waves
•
Any analysis of kelp on algae must
include waves as a conditioning
variable
•
Otherwise, waves would be a
confounding variable
What is a Confounder?
y
1
y
2
x
1
X1 is a
confounder -
it influences both y1 and y2
- information flows from y1 to y2 via x1
The Back-Door Effect
sensu
Judea Pearl
y
1
y
2
x
1
X1 is a
confounder -
We need to find a way to shut the back door!!!
Open Back Doors and Omitted Variable Bias
y
1
y
2
x
1
If we omit x1 from a model, our results will be
BIASED
Where does OVB Come From in a Model?
y
1
y
2
x
1
•
We have violated the assumption of
endogeneity
•
y1 is no longer
exogenous
to the system
•
We have induced a correlation between the random term and y1
e
If we KNOWINGLY
omit x1, models
linking y1 and y2 are
not
causally
identified
Omitted Variable Bias and Causal Identification
y
1
y
2
x
1
Causal Identification
Your model
need not be
causally identified
– but be
specific that you are only
talking about
associations/predictions
You can only make
counterfactual statements if
you are confident in causal
identification
y
1
y
2
x
1
Causal Identification
Causal identification does
not require knowing
ULTIMATE cause
Nor does it require knowing
exact mechanisms within a
causal pathway
y
1
y
2
x
1
How do we solve this problem?
This
relationship
is
not
causally
identified
y
1
y
2
x
1
Solution 1: Fulfill the Backdoor Criteria
•
Include variables that
block the pathway from
cause to effect
•
Variables must block all
backdoor paths from
cause to effect
•
AND variables must not
be descendants of the
cause
Proximate Backdoors
Cause
Effect
Exogenous Cause
Proximate Cause
Often we only have proximate variables in a backdoor path. Controlling
for just them is sufficient.
Proximate Backdoors and Regression
Cause
Proximate
Cause
Effect
Regression Model
Exogenous
Cause
What Variables Block the Back Door?
Y1
Y4
X1
Y2
There are two ways to build a multiple regression with closed back
doors to determine if Y1 -> Y4. What are they?
Y3
Sometimes We Cannot Shut the Backdoor
Cause
Effect
Billion Dollar
Environmental Covariates
Or, we suspect, but don’t know, of
backdoors
Cause
Effect
Who Knows
??
??
Independent
Mediator
Solution 2: The Front-Door Criterion
•
A variable satisfies the front-door
criteria when it blocks all paths
from X to Y.
•
In practice, you need a causally
identified mediating variable
unaffected by anything else.
•
Thus, the influence of the cause is
felt by the effect solely through its
mediator.
Example: Smoking and Cancer
Smoking
Cancer
Other factors (genetic,
stress, environment)
Tar in
Lungs
See Pearl’s books and papers for the do calculus of this
Example: Sharing a Rideshare
Chose a Shared
Lyft/Uber
Tip
Amount
Cheap People make
Cheap Choices
Get a Shared
Lyft/Uber
Bellemere et al. 2022 The Paper of How: Estimating Treatment Effects Using the Front-Door Criterion
∗
Example: Sharks and Bivalves
Arif and MacNeil 2022
Building an Understanding of Our System
1.
Introduction to Causal Thinking
2.
Anatomy of Causal Diagrams
3.
Using our Causal Diagrams:
•
Conditional Independence
•
Confounding, Backdoors, and Frontdoors
•
Counterfactual Thinking
Kelp
Invertebrates
Waves
Algae
Counterfactual Thinking: What would Happen
If….
The Present
Near Future
Far Future
Kelp
Invertebrates
Waves
Algae
Seemingly Simple, But, At the Core of
Understanding Causality
•
We want to estimate an
Average CAUSAL Effect
of
waves on invertebrates
•
We observe Inverts With Waves – Inverts Without
Waves
•
This is a
POPULATION
phenomenon – the
Average
Treatment Effect
•
From our measurements, we only observe what
happens with waves or no waves in the sample we
have
•
What would have happened if those same replicates
had opposite the “treatments”? Would our
observation hold?
Kelp
Invertebrates
Waves
Algae
DAGs Let us See If We Can Estimate Valid ATEs and Make
Counterfactual Predictions
Difference in means = ATE +
Selection Bias +
Treatment Heterogeneity Bias
•
Do confounders lead to selection bias?
•
Have we controlled for selection bias in our
sample or experiment?
•
Are “treatments” uniform? Or being
experienced in the same way?
Kelp
Invertebrates
Waves
Algae
Using DAGs to Get ATEs for Inference Requires Methods to
Remove Bias
Difference in means = ATE +
Selection Bias +
Treatment Heterogeneity Bias
•
Our job is to remove bias so Difference in
Means = ATE
•
Experiments
let us remove selection and
heterogeneity bias by removing drivers of
bias
•
Observational studies
let us remove bias via
carefully constructed models based on DAGS
•
We can even include interactions!
Kelp
Invertebrates
Waves
Algae
DAGS + Counterfactuals = Clear Inference
•
With a DAG, we can see potential sources of
bias
•
We can use counterfactual thinking here to
understand how changing waves should
cascade through the system
•
In practice, we can see what variables might
obscure our counterfactual inferences
What do you need to control for to have valid
counterfactual inference?
Boxes and Arrows, Oh My!
•
Causal Diagrams let you be specific about
cause and effect in a system
•
We can incorporate many aspects of our
knowledge into Causal Diagrams
•
Causal Diagrams illuminate potential
confounders to watch out for via Back-Door
effects
•
Causal diagrams let us design effective
experiments and observational studies

Download Presentation

Please find below an Image/Link to download the presentation.
The content on the website is provided AS IS for your information and personal use only. It may not be sold, licensed, or shared on other websites without obtaining consent from the author.If you encounter any issues during the download, it is possible that the publisher has removed the file from their server.
You are allowed to download the files provided on this website for personal or commercial use, subject to the condition that they are used lawfully. All files are the property of their respective owners.
The content on the website is provided AS IS for your information and personal use only. It may not be sold, licensed, or shared on other websites without obtaining consent from the author.
E N D
Presentation Transcript
Goals of Science and Links Between Them Causal Pattern Recognition Understanding Prediction & Forecasting Mechanistic Understanding All are valid and useful in particular contexts What are YOU seeking to do?
What is your question? Is it fundamentally causal? Or not?
Do You Need to be Doing Causal Inference? No! Not all studies will provide causal links between different variables of interest If the study goal is predictive or descriptive rather than causal, this might not be needed But We cannot hope to understand the world without developing an understanding of causal associations Indeed Understanding the clockwork machinery of the universe is an end goal of science one which we can never achieve, but strive for!
Building an Understanding of Our System 1. Introduction to Causal Thinking and Potential Outcomes 2. Causal Diagrams 3. Using our Causal Diagrams: Conditional Independence Backdoors and Frontdoors Counterfactual Thinking
The Classic Example Used to Dissuade us from Causal Thinking Church of the Flying Spaghetti Monster
What is Causal Thinking? Do waves drive biodiversity of invertebrates? POTENTIAL OUTCOMES Treated Di = 1 Y1i Unit Yi Untreated Di =0 Y0i
If we Only Observed Di = 1, Y0i is Counterfactual and vice-versa POTENTIAL OUTCOMES Treated Di = 1 Y1i Unit Yi Untreated Di =0 Y0i
What we Want to Know: The Potential Outcomes Framework Di = 1 Average Treatment Effect Y1i ATE = E[Y1i - Y0i]? Di = 0 BUT we CANNOT observe both Y1i and Y0i Y0i Neyman-Rubin Framework, see Holland 1986 JSA
What We Hope For Unit Y | D = 0 Y | D = 1 Y1i Y01 D A 3 4 1 1 B 6 7 1 1 C 3 4 1 1 D 2 3 1 1 E 5 6 1 0 F 1 2 1 0 G 6 7 1 0 H 9 10 1 0 ATE = E[Y1i Y0i] = E[Y1i] E[Y0i] = 1
What We Have Unit Y | D = 0 Y | D = 1 D A 4 1 B 7 1 C 4 1 D 3 1 E 5 0 F 1 0 G 6 0 H 9 0 ATE = E[Y1 Y0] = E [Y1] E[Y0] = 4.5 5.25 = -0.75 WAIT, WHAT?!?!?!?!?!?!
Treatment Effects in a Partially Observed World Di = 1 Y1i Difference in means = ATE + Selection Bias + Treatment Heterogeneity Bias Di = 0 Y0i
Selection Bias: Unequal Representation Units from D = 1 Differences in units between treated and untreated that create bias Can be that units are different or have different other external forces influencing them Units from D = 0 We get around this with experimental or statistical design controls
Treatment Heterogeneity Bias Applied Treatment Units from D = 1 Units in different treatment groups responded in different ways Can adjust for with experimental or statistical design control If we Had Applied Treatment Units from D = 0
What are Our Potential Enemies and Solutions for Potential Outcomes? We must find ways to parcel out selection bias and treatment heterogeneity in experiments We must find ways to adjust or control for selection bias and treatment heterogeneity in observations We must imagine counterfactual outcomes But HOW do we know what to adjust and control for?
Building an Understanding of Our System 1. Introduction to Causal Thinking 2. Causal Diagrams 3. Using our Causal Diagrams: Conditional Independence Backdoors and Frontdoors Counterfactual Thinking
The Core of Causal Inference what you want to evaluate Cause Effect In your research, what is your primary cause and effect of interest?
Directed Acyclic Graphs as a Means of Describing the World AKA path diagram, AKA DAG
Directed Acyclic Graphs as a Means of Describing the World Boxes represent OBSERVED variables
Directed Acyclic Graphs as a Means of Describing the World Directed Arrows show flow of causality (information)
Exogenous Drivers of a System Exogenous variable = ultimate independent variable, predictor, unexplained x1
Endogenous Variables are Inside of a System Exogenous variable Endogenous variable = dependent variable, response x1 y2 y1 Note: You might not be interested in an exogenous variable, or connection between pairs of variables, but you cannot design a study without understanding a system.
Mediators are Endogenous Variables that Can Also Be Predictors Exogenous variable Endogenous variable x1 y2 y1 Endogenous Mediator Variable = Endogenous variable that drives other endogenous variables Often we are interested in a mediator variable but we cannot assess its importance without the exogenous variable
Direct Effects Have No Mediators Direct Effect x1 y2 y1 This does not mean there are not other mediators between x1 and y2, but, those mediators are not influenced by anything else in the system.
Indirect Effects Flow Through a Mediators Direct Effect x1 y2 y1 Indirect Effect If we do not measure y1, we can only assess the TOTAL EFFECT of x1 on y2 which might be 0, but doesn t mean there is no causal link!
Unobserved Variables are Error or Things We Have Not Measured Unobserved Latent Variable Everything else affecting y2 e2 e2 x1 y2 y1 Unobserved Latent Variable Everything else affecting y1 Note: unless something wild is going on with error, we often don t draw it. e1 e1
There Can Be Connections Between Unobserved Variables x3 x1 y2 y1 If we do not consider these, we *can* produce invalid inferences x2
You Can Have Multiple Unobserved Variables: Random v. Systematic Error e2 x3 x1 y2 Knowing the structure of your system, what you have, and what you have not measured is key y1 x2 e1 x4
Interaction Effects: Moderators x1 y1 e1 x2 OR x1 x1*x2 y1 e1 x2
You Can Have an Uncertain of Unanalyzed Correlation Between Variables Unexplained correlation x1 y1 x2 e1
Really This Represents a Correlation Between Unexplained Variances 1 d1 x1 y1 2 d1 x2 e1
Could be Due to a Shared Driver 1 d1 x1 d3 y1 2 d1 x2 e1
Could Be Due to a Directed Relationship 1 d1 x1 y1 2 d1 x2 e1 If correlation is between exogenous variables, we don t care. If endogenous, we need to consider *why* as it can affect modeling choices and experimental design.
Why All of this Worry About Structure of a Whole System? x1 y2 y1 Is it possible to assess the causal relationship between y1 and y2 if you do not know x1? What can you say about any measured relationship between y1 and y2 if x1 varies, but is unmeasured?
Draw Your System Start with what is the variable you are ultimately interested in. What influences that variable DIRECTLY? What things influence those variables? Note what you have/can measure and what you cannot.
Building an Understanding of Our System 1. Introduction to Causal Thinking 2. Anatomy of Causal Diagrams 3. Using our Causal Diagrams: Conditional Independence Backdoors and Frontdoors Counterfactual Thinking
What Is It Good For? We can test our intuition by examining things that do not connect x1 We cannot take apart our system without imagining what would happen if something changes. We can begin to understand what we must grapple with to tease apart the Gordian knot of Simpson s Paradox and confounders y2 y1
So Lets Draw a DAG: Where we Start Waves Invertebrates
But there are Mediators Waves Kelp Algae Invertebrates
So Waves are Conditionally Independent of Invertebrates Waves Kelp Algae Invertebrates
Conditional Independence: The Hard Causal Claim y1 x y3 y2 These two relationships are declared to be non-existent This is a hard causal claim Is it real? How do we assess?
Quick Note: Nonlinearities Conditional indepdence generally excludes non- linear components (interactions) x1 y1 y2 x2 1. x1 y2 | (y1) 2. x2 y2 | (y1) 3. x1 * x2 y2 | (y1)
What claims of conditional independence do *you* have involving your response of interest? (and are they plausible?)
Conditional Independence (Directed Separation) Concept from Graph Theory y1 Two nodes are d- separated if they are conditionally independent e.g., the effect of x on y3 is zero conditioning on the influences of y1and y2 x y3 y2 x y3 | y1, y2
What does Conditional Independence Mean Here? Wave -> Invert Analyses CANNOT include Kelp and Algae It would only show conditional independence Waves Sampling must cover a wide range of kelp and algae Otherwise, we would miss the wave -> invert relationship Kelp Algae Invertebrates Waves Inverts | Kelp, Algae
What does Conditional Independence Mean Here? If you tried to look at the relationship between kelp and algae, conditioned on invertebrates, you d induce conditional dependence Waves Any analysis of kelp on algae must include waves as a conditioning variable Otherwise, waves would be a confounding variable Kelp Algae Invertebrates Kelp Algae | Waves
Building an Understanding of Our System 1. Introduction to Causal Thinking 2. Anatomy of Causal Diagrams 3. Using our Causal Diagrams: Conditional Independence Confounding, Backdoors, and Frontdoors Counterfactual Thinking
Confounding Variables Any analysis of kelp on algae must include waves as a conditioning variable Otherwise, waves would be a confounding variable Waves Kelp Algae Invertebrates Kelp Algae | Waves