Case-Control Studies in Genetic Research


Case-Control studies
Bryce Seifert, Ph.D. and Jen McGlaughon, Ph.D.
Biocurator Working Group
10/26/17

Case-Control Studies
•
Case cohort
Individuals ascertained from an institute, academic medical center, etc. or from
multiple centers based on a given phenotype or disease.
Could also be part of a defined population at risk (e.g. lifetime- or relative-risk
studies).
o
Usually based on clinical indicators of hereditary predisposition (e.g. Family history, young age
of onset).
o
Unselected(i.e. only ascertained based on phenotype and/or disease).
•
Control cohort
Individuals that are typically unaffected, serve as comparison group (noncases).
Some studies ascertain controls that lack the phenotype or disease of interest, but
may not otherwise be unaffected for other phenotypes (e.g. cancer-free controls
that have cardiac phenotypes). Relative risk analyses may include relatives of
probands
o
May or may not be matched to the case cohort.
•
Meta-analyses: case and control cohorts typically drawn from multiple
studies and published as one large set.
Fletcher et al., 1996
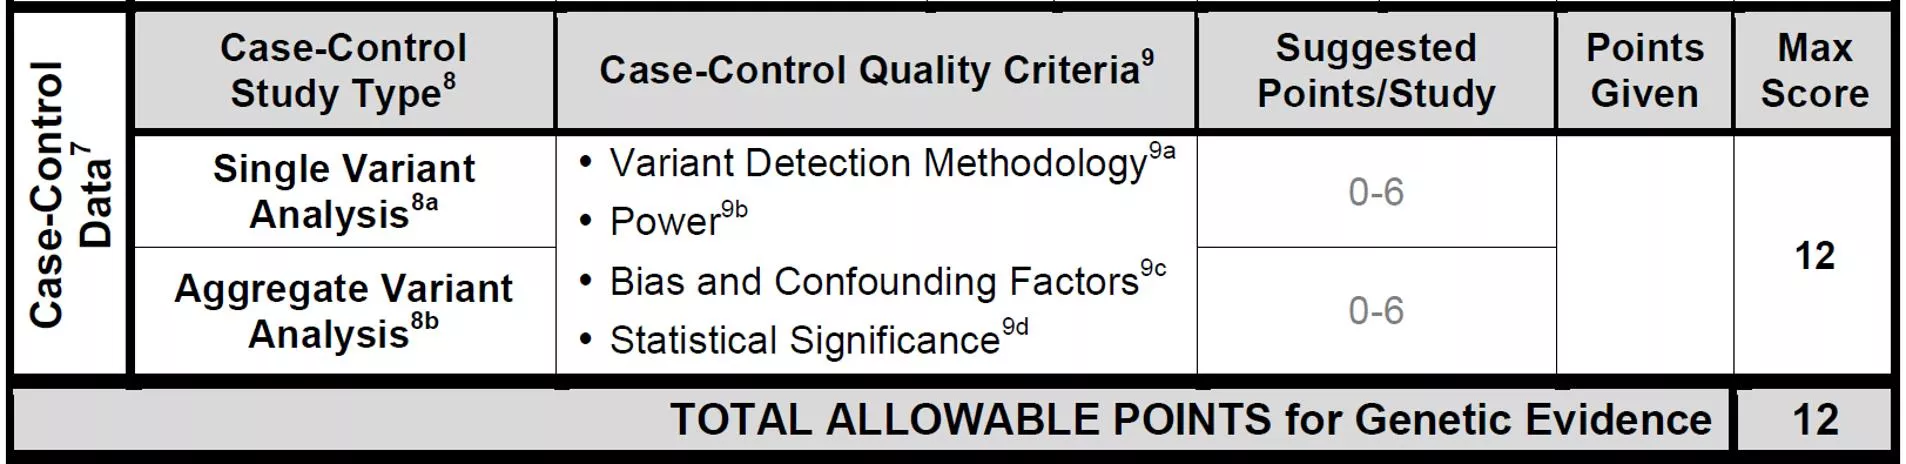
Quality Criteria
Study type: Single Variant Analysis or Aggregate Analysis
Variant Detection Methodology
o
Were both cases and controls sequenced for the entire gene under analysis or genotyped for the variant
under analysis?
Pay attention to the Methods section (sequencing, genotyping subsection) – example: cases sequenced for all
exons in
PALB2
and a nonsense variant is identified. The specific variant is subsequently genotyped in controls
without sequencing all
PALB2
exons. Cases and controls are not matched for variant detection methodology.
Power
o
Analysis of a sufficient number of cases and controls – dependent on prevalence of disease, allele
frequency, effect size of gene being analyzed.
Bias/Confounding
o
Are controls matched to cases based on ethnicity, location of recruitment, genetic ancestry, age, gender?
o
Cases and controls equivalently evaluated for presence/absence of phenotype, family history?
o
Previous testing conducted on cases?
o
Cases ascertained due to being from families with disease history (ascertainment bias)?
Statistical significance
o
Weigh this value carefully, considering the strength of statistical association. If multiple pair-wise
comparisons are conducted, check for multiple test correction.
Cohort composition: if cases overlap across studies, be sure not to double-count
studies (e.g. meta-analyses encompassing 5 earlier studies, do not count the 5
earlier studies and the meta-analysis, but just one or the other).
Measures of association and risk
•
Odds Ratio (OR)
– measures the frequency of variants among cases versus
controls (a stronger association between variant(s) in a gene and disease
results in a higher odds ratio).
o
HBOC and Colorectal cancer/Polyposis Gene Disease Curation Teams (GDCT) employ
cut-off OR = 2.0 and 95% confidence interval that does not cross below 1.0, p-value
<0.05 or <0.001 depending on the study.
o
Disease-specific OR and confidence interval thresholds should be discussed with
GDCT experts.
o
Mantel Haenszel Odds Ratio: often seen in meta-analyses. Pooled OR across
multiple studies (fixed effects models assumed).
•
Fisher’s exact test
– measures if the proportion of cases with variant(s) is
significantly different from the proportion of controls with variant(s)
o
P-
value
o
Similar to Chi-Squared test
Fletcher et al., 1996; McDonald, 2014
https://www.statsdirect.com/help/meta_analysis/mh.htm
•
Relative risk (RR):
How likely are individuals with variant(s) to become
affected, relative to individuals that lack the variant(s). E.g. RR = 2,
Heterozygous variant carriers are 2 times more likely to develop breast
cancer than individuals that lack the variant(s).
•
Standardized risk ratio (SRR):
ratio of the weighted average of category-
specific risks (e.g. ratio of observed frequency of pathogenic variants in
cancer cases by summed frequency all pathogenic variants in a control
population).
•
Standardized incidence ratio (SIR
)
: ratio of the observed number of
disease cases/expected number of disease cases (note: expected number is
what might be expected if the population had the same experience as a
some larger comparison population)
•
Hazard ratio (HR)
: how often disease happens in one group (e.g.
individuals with pathogenic variants) versus another group (e.g. individuals
without variants), over time.
Measures of association and risk
Fletcher, et al., 1996; Flanders and Rhodes, 1987; Ressing et al., 2010
https://www.cancer.gov/publications/dictionaries/cancer-terms?cdrid=618612
Example: Breast cancer
PMID:
28418444; Couch et al. 2017,
ATM:
Breast cancer
•
Aggregate Variant Analysis of 29,229 Caucasian breast cancer cases referred for
panel testing to Ambry. Cases sequenced by NGS for 16 susceptibility genes and
compared to 26,644 ExAC-Non-Finnish European (NFE) controls (TCGA excluded).
•
Variants were Pathogenic (P) or Likely Pathogenic (LP) in cases by Ambry’s
classification system and Control variants in individuals in ExAC deemed P/LP by
Ambry’s system. Control P/LP variants also included nonsense, frameshift,
consensus splice-site variants. Additionally, controls included individuals with
missense variants deemed P/LP in ClinVar by clinical laboratories.
Factors to consider
•
Variant detection methodology:
ATM sequenced in cases and
controls (matched)
•
Power
: total number of cases and controls sufficient for breast cancer.
•
Statistical significance:
OR =2.78, 95% CI: 2.22-3.62,
P
-value: 2.42 X
10
-19
•
Bias/Confounding
: controls matched to cases based on ethnicity, but
not genetic ancestry, location of recruitment, age.
4 points due to power of the
study and use of ethnicity
matched controls
Example: Colorectal cancer
Case-control study: colorectal cancer
PMID: 27329137; Chubb, 2016
•
Cases:
1,028 unrelated patients
with CRC, ≤55 years at Dx, who had
at least 1 first-degree relative with
CRC (1,006 after QC).
•
UK residents with self-reported
European ancestry.
•
Controls:
1,644 healthy individuals
from the UK (1,609 after QC).
•
Using HapMap data, they excluded
individuals who had non-northern
European ancestry.
Methods
PMID: 27329137; Chubb, 2016
•
WES was performed on cases and controls.
•
First examined individual, moderately low-
frequency coding variants (MAF 1-5%) for an
association with CRC risk.
•
To maximize statistical significance, performed meta-
analysis on additional 5,552 cases and 6,792 controls that
were genotyped.
•
Next examined impact of rare alleles (MAF<1%)
collectively within a gene on CRC risk by
aggregating SNVs and indels in each gene and
comparing the counts between cases and controls.
•
To search for novel CRC susceptibility genes,
confined analysis to 863 cases w/o a probable
disease-causing mutation in an established CRC
gene.
•
Used WGS on an additional 188 cases and 3,582 UK
controls.
Gene-centric analysis
PMID: 27329137; Chubb, 2016
•
Performed a collapsing burden test imposing a max MAF threshold of 1%
(T1 test) then applied the T1 test to 3 different types of variants:
•
(1) Disruptive, (2) Predicted damaging, (3) Non-synonymous (all coding non-
synonymous variants).
•
Exome wide significance was considered to be
P
=8.0x10
-7
, corresponding to
a Bonferroni correction for the testing of ~20,000 genes and three variant
sets.
MLH1 P=6.67x10
-7
Factors to consider
PMID: 27329137; Chubb, 2016
•
Variant detection methodology
: WES was performed for cases and
controls.
•
Power:
CRC is common, so it may have been helpful to have more cases,
but experts agreed this was sufficiently powered.
•
Bias and confounding factors:
Cases and controls were matched by
location and ancestry.
•
Controls that developed cancer during the study were excluded.
•
Calculated a similarity metric to assess identity-by-state; no related individuals were
identified.
•
Controls at time of submission of paper would have been ~58 years (2016-1958 = 58
years), the mean age of the cases was 47
±6 years.
•
Statistical significance:
P
value for MLH1 fell below the threshold
(
P
=8x10
-7
) for the multiple comparison testing.
5 points assigned
Example: Serrated Polyposis
24512911; Gala et al. 2014,
RNF43
:Polyposis
•
20 unrelated cases from Massachusetts General Hospital with sessile
serrated adenomas that fulfilled modified WHO diagnostic criteria for
serrated polyposis. 4300 European Americans from NHBLI ESP as controls.
2/20 cases with
RNF43
truncating variants, 1/4300 controls with
RNF43
truncating variants. “The cohort allelic sums test was employed to assess
enrichment of strong LoF mutations of the gene set in cases compared to
controls”.
Factors to consider
•
Variant detection methodology:
RNF43
sequenced in cases and
controls (matched).
•
Power
: Case cohort very small, even though serrated polyposis was
phenotype of interest. 555 gene comparisons made, multiple test
correction resulted in
P
-value <9X10
-5
as significant.
•
Statistical significance:
OR, 460; 95% CI, 23.1–16,384; P = 6.8 E -5.
•
Bias/Confounding
:Large control set may have inflated Odds Ratio,
controls somewhat ethnicity-matched.
Example: Hypertrophic
cardiomyopathy
Case-control study: hypertrophic cardiomyopathy
PMID: 27532257; Walsh, 2015
•
Cases:
Data from 3,267 individuals diagnosed with HCM, 559 with
DCM, and 361 with ARVC obtained from Oxford Medical Genetics
Laboratory.
•
Data from LMM were downloaded from previous publications (632-2,912
HCM patients, 121-756 DCM patients).
•
Controls:
Data were downloaded from ExAC database.
•
Applied a MAF threshold of 1x10
-4
as a conservative upper bound
because variants more frequent than this is the general population
would likely not be highly penetrant pathogenic mutations.
•
Most common pathogenic variant in both clinical cohorts was MYBPC3
c.1504C>T (p.Arg502Trp) which was found in 1.7% HCM cases and 2.5x10
-5
in
ExAC.
Methods
PMID: 27532257; Walsh, 2015
•
For each gene, frequency of rare variants (MAF<1x10⁻⁴) in ExAC was
calculated by dividing the sum of the adjusted allele count by the mean of
the total adjusted alleles.
•
In cardiomyopathy cohorts, it was calculated by the total number of
patients analyzed for each gene.
•
For each gene, the frequency of rare variation in the clinical cohort was
compared with that in ExAC.
•
Case excess defined by subtracting proportion of individuals in ExAC with a filtered
variant from the proportion in the clinical chorts.
•
For each gene and variant class, calculated:
•
Odds ratio (OR)- ratio of odds of cardiomyopathy comparing rare variant carriers with
noncarriers.
•
Etiological fraction (EF)- estimates the proportion of cases in which the exposure (a rare
variant in a gene) was causal.
Results
PMID: 27532257; Walsh, 2015
Figure 2 Odds ratios (OR) with 95% confidence interval (CI) for each gene tested
in the hypertrophic cardiomyopathy (HCM) (n = 632 to 6,179), dilated
cardiomyopathy (DCM) (n = 121 to 131), and arrhythmogenic right ventricular
cardiomyopathy (ARVC) (n= 93 to 361) clinical cohorts compared with Exome
Aggregation Consortium (ExAC) reference samples (n = mean of total adjusted
allele count for rare variant carriers. for HCM genes, n = 47,153 to 60,647; for
DCM genes, n = 42,697 to 60,647; and for ARVC genes, n = 51,126 to 60,218).
See Supplementary Table S5a–c online for data used to generate this plot. Data
have been plotted (log10 scale) for all protein-altering variants (black) and
truncating variants (blue). For truncating variants, OR with 95% CI have been
plotted for genes where a statistically significant difference was observed for
this variant type on FET. *Statistically significant Fisher’s exact test (FET) (P=0.05
with Bonferroni correction; HCM P ≤ 0.0025; DCM P ≤ 0.001; and ARVC P ≤
0.006.). ^Genes analyzed in fewer than 200 cases. CTF1 and RBM20 were
removed from analysis owing to poor coverage in ExAC.
Factors to consider
PMID: 27532257; Walsh, 2015
•
Variant detection methodology
: Sequencing data from diagnostic labs for
cases, exome sequencing for controls.
•
Power:
HCM is relatively common and is estimated at 1:500 in the general
population.
•
Applied a max frequency based on the most pathogenic mutation.
•
Assessed 7,855 cardiomyopathy samples and 60,706 reference samples.
•
Bias and confounding factors:
Controls (ExAC) not closely matched to
cases.
•
Unsure of the quality of phenotype evaluation of controls.
•
Statistical significance:
Fisher’s exact test to determine the significance of
observed excess in cases, OR, and EF.
2 points assigned
References
•
Ressing, M., Blettner, M., Klug, SJ.
Data analysis of epidemiological studies: part 11 of a series on evaluation
of scientific publications
.
Dtsch Arztebl Int. 2010 Mar;107(11):187-92. doi: 10.3238/arztebl.2010.0187.
•
Flanders, W.D., and Rhodes, P.H.
Large sample confidence intervals for regression standardized risks, risk
ratios, and risk differences.
J Chronic Dis. 1987;40(7):697-704.
PMID:3597672
•
Fletcher, R.H., Fletcher, S.W., and Wagner, E.H.,
Clinical Epidemiology: The Essentials.
3rd ed., Baltimore:
Williams & Wilkins, 1996. Accessed online 26 October 2017
(
http://202.74.245.22:8080/xmlui/bitstream/handle/123456789/405/Clinical%20Epidemiology%20by%20Ro
bert%20H.%20Fletcher.pdf?sequence=1
).
•
McDonald, J.H.
Handbook of Biological Statistics.
3rd ed., Baltimore: Sparky House Publishing, 2014. 77-85.
Accessed online 24 October 2017 (
http://www.biostathandbook.com/fishers.html
).
•
https://www.cancer.gov/publications/dictionaries/cancer-terms?cdrid=618612
•
https://www.statsdirect.com/help/meta_analysis/mh.htm
Case-control studies are a common research design in genetics to investigate the association between genetic variants and diseases. This method involves comparing individuals with a specific phenotype (cases) to those without it (controls). Quality criteria such as study type, power analysis, bias/confounding, and statistical significance are essential for the validity of the results. Measures of association and risk like Odds Ratio and Mantel-Haenszel Odds Ratio play a crucial role in analyzing the frequency of variants among cases and controls. Meta-analyses combining data from multiple studies can provide a more comprehensive understanding of genetic associations.

Download Presentation

Please find below an Image/Link to download the presentation.
The content on the website is provided AS IS for your information and personal use only. It may not be sold, licensed, or shared on other websites without obtaining consent from the author.If you encounter any issues during the download, it is possible that the publisher has removed the file from their server.
You are allowed to download the files provided on this website for personal or commercial use, subject to the condition that they are used lawfully. All files are the property of their respective owners.
The content on the website is provided AS IS for your information and personal use only. It may not be sold, licensed, or shared on other websites without obtaining consent from the author.
E N D
Presentation Transcript
Case-Control studies Bryce Seifert, Ph.D. and Jen McGlaughon, Ph.D. Biocurator Working Group 10/26/17
Case-Control Studies Case cohort Individuals ascertained from an institute, academic medical center, etc. or from multiple centers based on a given phenotype or disease. Could also be part of a defined population at risk (e.g. lifetime- or relative-risk studies). o Usually based on clinical indicators of hereditary predisposition (e.g. Family history, young age of onset). o Unselected(i.e. only ascertained based on phenotype and/or disease). Control cohort Individuals that are typically unaffected, serve as comparison group (noncases). Some studies ascertain controls that lack the phenotype or disease of interest, but may not otherwise be unaffected for other phenotypes (e.g. cancer-free controls that have cardiac phenotypes). Relative risk analyses may include relatives of probands o May or may not be matched to the case cohort. Meta-analyses: case and control cohorts typically drawn from multiple studies and published as one large set. Fletcher et al., 1996
Quality Criteria Study type: Single Variant Analysis or Aggregate Analysis Variant Detection Methodology o Were both cases and controls sequenced for the entire gene under analysis or genotyped for the variant under analysis? Pay attention to the Methods section (sequencing, genotyping subsection) example: cases sequenced for all exons in PALB2 and a nonsense variant is identified. The specific variant is subsequently genotyped in controls without sequencing all PALB2 exons. Cases and controls are not matched for variant detection methodology. Power o Analysis of a sufficient number of cases and controls dependent on prevalence of disease, allele frequency, effect size of gene being analyzed. Bias/Confounding o Are controls matched to cases based on ethnicity, location of recruitment, genetic ancestry, age, gender? o Cases and controls equivalently evaluated for presence/absence of phenotype, family history? o Previous testing conducted on cases? o Cases ascertained due to being from families with disease history (ascertainment bias)? Statistical significance o Weigh this value carefully, considering the strength of statistical association. If multiple pair-wise comparisons are conducted, check for multiple test correction. Cohort composition: if cases overlap across studies, be sure not to double-count studies (e.g. meta-analyses encompassing 5 earlier studies, do not count the 5 earlier studies and the meta-analysis, but just one or the other).
Measures of association and risk Odds Ratio (OR) measures the frequency of variants among cases versus controls (a stronger association between variant(s) in a gene and disease results in a higher odds ratio). o HBOC and Colorectal cancer/Polyposis Gene Disease Curation Teams (GDCT) employ cut-off OR = 2.0 and 95% confidence interval that does not cross below 1.0, p-value <0.05 or <0.001 depending on the study. o Disease-specific OR and confidence interval thresholds should be discussed with GDCT experts. o Mantel Haenszel Odds Ratio: often seen in meta-analyses. Pooled OR across multiple studies (fixed effects models assumed). Fisher s exact test measures if the proportion of cases with variant(s) is significantly different from the proportion of controls with variant(s) o P-value o Similar to Chi-Squared test Fletcher et al., 1996; McDonald, 2014 https://www.statsdirect.com/help/meta_analysis/mh.htm
Measures of association and risk Relative risk (RR): How likely are individuals with variant(s) to become affected, relative to individuals that lack the variant(s). E.g. RR = 2, Heterozygous variant carriers are 2 times more likely to develop breast cancer than individuals that lack the variant(s). Standardized risk ratio (SRR): ratio of the weighted average of category- specific risks (e.g. ratio of observed frequency of pathogenic variants in cancer cases by summed frequency all pathogenic variants in a control population). Standardized incidence ratio (SIR): ratio of the observed number of disease cases/expected number of disease cases (note: expected number is what might be expected if the population had the same experience as a some larger comparison population) Hazard ratio (HR): how often disease happens in one group (e.g. individuals with pathogenic variants) versus another group (e.g. individuals without variants), over time. Fletcher, et al., 1996; Flanders and Rhodes, 1987; Ressing et al., 2010 https://www.cancer.gov/publications/dictionaries/cancer-terms?cdrid=618612
PMID: 28418444; Couch et al. 2017, ATM:Breast cancer Aggregate Variant Analysis of 29,229 Caucasian breast cancer cases referred for panel testing to Ambry. Cases sequenced by NGS for 16 susceptibility genes and compared to 26,644 ExAC-Non-Finnish European (NFE) controls (TCGA excluded). Variants were Pathogenic (P) or Likely Pathogenic (LP) in cases by Ambry s classification system and Control variants in individuals in ExAC deemed P/LP by Ambry s system. Control P/LP variants also included nonsense, frameshift, consensus splice-site variants. Additionally, controls included individuals with missense variants deemed P/LP in ClinVar by clinical laboratories.
Factors to consider Variant detection methodology: ATM sequenced in cases and controls (matched) Power: total number of cases and controls sufficient for breast cancer. Statistical significance: OR =2.78, 95% CI: 2.22-3.62, P-value: 2.42 X 10 -19 Bias/Confounding: controls matched to cases based on ethnicity, but not genetic ancestry, location of recruitment, age. 4 points due to power of the study and use of ethnicity matched controls
Case-control study: colorectal cancer PMID: 27329137; Chubb, 2016 Cases: 1,028 unrelated patients with CRC, 55 years at Dx, who had at least 1 first-degree relative with CRC (1,006 after QC). UK residents with self-reported European ancestry. Controls: 1,644 healthy individuals from the UK (1,609 after QC). Using HapMap data, they excluded individuals who had non-northern European ancestry.
Methods PMID: 27329137; Chubb, 2016 WES was performed on cases and controls. First examined individual, moderately low- frequency coding variants (MAF 1-5%) for an association with CRC risk. To maximize statistical significance, performed meta- analysis on additional 5,552 cases and 6,792 controls that were genotyped. Next examined impact of rare alleles (MAF<1%) collectively within a gene on CRC risk by aggregating SNVs and indels in each gene and comparing the counts between cases and controls. To search for novel CRC susceptibility genes, confined analysis to 863 cases w/o a probable disease-causing mutation in an established CRC gene. Used WGS on an additional 188 cases and 3,582 UK controls.
Gene-centric analysis PMID: 27329137; Chubb, 2016 Performed a collapsing burden test imposing a max MAF threshold of 1% (T1 test) then applied the T1 test to 3 different types of variants: (1) Disruptive, (2) Predicted damaging, (3) Non-synonymous (all coding non- synonymous variants). Exome wide significance was considered to be P=8.0x10⁻⁷, corresponding to a Bonferroni correction for the testing of ~20,000 genes and three variant sets. MLH1 P=6.67x10⁻⁷
Factors to consider PMID: 27329137; Chubb, 2016 Variant detection methodology: WES was performed for cases and controls. Power: CRC is common, so it may have been helpful to have more cases, but experts agreed this was sufficiently powered. Bias and confounding factors: Cases and controls were matched by location and ancestry. Controls that developed cancer during the study were excluded. Calculated a similarity metric to assess identity-by-state; no related individuals were identified. Controls at time of submission of paper would have been ~58 years (2016-1958 = 58 years), the mean age of the cases was 47 6 years. Statistical significance: P value for MLH1 fell below the threshold (P=8x10⁻⁷) for the multiple comparison testing. 5 points assigned
24512911; Gala et al. 2014, RNF43:Polyposis 20 unrelated cases from Massachusetts General Hospital with sessile serrated adenomas that fulfilled modified WHO diagnostic criteria for serrated polyposis. 4300 European Americans from NHBLI ESP as controls. 2/20 cases with RNF43 truncating variants, 1/4300 controls with RNF43 truncating variants. The cohort allelic sums test was employed to assess enrichment of strong LoF mutations of the gene set in cases compared to controls .
Factors to consider Variant detection methodology:RNF43 sequenced in cases and controls (matched). Power: Case cohort very small, even though serrated polyposis was phenotype of interest. 555 gene comparisons made, multiple test correction resulted in P-value <9X10⁻⁵ as significant. Statistical significance: OR, 460; 95% CI, 23.1 16,384; P = 6.8 E -5. Bias/Confounding:Large control set may have inflated Odds Ratio, controls somewhat ethnicity-matched.
Example: Hypertrophic cardiomyopathy
Case-control study: hypertrophic cardiomyopathy PMID: 27532257; Walsh, 2015 Cases: Data from 3,267 individuals diagnosed with HCM, 559 with DCM, and 361 with ARVC obtained from Oxford Medical Genetics Laboratory. Data from LMM were downloaded from previous publications (632-2,912 HCM patients, 121-756 DCM patients). Controls: Data were downloaded from ExAC database. Applied a MAF threshold of 1x10⁻⁴ as a conservative upper bound because variants more frequent than this is the general population would likely not be highly penetrant pathogenic mutations. Most common pathogenic variant in both clinical cohorts was MYBPC3 c.1504C>T (p.Arg502Trp) which was found in 1.7% HCM cases and 2.5x10⁻⁵ in ExAC.
Methods PMID: 27532257; Walsh, 2015 For each gene, frequency of rare variants (MAF<1x10⁻⁴) in ExAC was calculated by dividing the sum of the adjusted allele count by the mean of the total adjusted alleles. In cardiomyopathy cohorts, it was calculated by the total number of patients analyzed for each gene. For each gene, the frequency of rare variation in the clinical cohort was compared with that in ExAC. Case excess defined by subtracting proportion of individuals in ExAC with a filtered variant from the proportion in the clinical chorts. For each gene and variant class, calculated: Odds ratio (OR)- ratio of odds of cardiomyopathy comparing rare variant carriers with noncarriers. Etiological fraction (EF)- estimates the proportion of cases in which the exposure (a rare variant in a gene) was causal.
Results PMID: 27532257; Walsh, 2015 Figure 2 Odds ratios (OR) with 95% confidence interval (CI) for each gene tested in the hypertrophic cardiomyopathy (HCM) (n = 632 to 6,179), dilated cardiomyopathy (DCM) (n = 121 to 131), and arrhythmogenic right ventricular cardiomyopathy (ARVC) (n= 93 to 361) clinical cohorts compared with Exome Aggregation Consortium (ExAC) reference samples (n = mean of total adjusted allele count for rare variant carriers. for HCM genes, n = 47,153 to 60,647; for DCM genes, n = 42,697 to 60,647; and for ARVC genes, n = 51,126 to 60,218). See Supplementary Table S5a c online for data used to generate this plot. Data have been plotted (log10 scale) for all protein-altering variants (black) and truncating variants (blue). For truncating variants, OR with 95% CI have been plotted for genes where a statistically significant difference was observed for this variant type on FET. *Statistically significant Fisher s exact test (FET) (P=0.05 with Bonferroni correction; HCM P 0.0025; DCM P 0.001; and ARVC P 0.006.). ^Genes analyzed in fewer than 200 cases. CTF1 and RBM20 were removed from analysis owing to poor coverage in ExAC.
Factors to consider PMID: 27532257; Walsh, 2015 Variant detection methodology: Sequencing data from diagnostic labs for cases, exome sequencing for controls. Power: HCM is relatively common and is estimated at 1:500 in the general population. Applied a max frequency based on the most pathogenic mutation. Assessed 7,855 cardiomyopathy samples and 60,706 reference samples. Bias and confounding factors: Controls (ExAC) not closely matched to cases. Unsure of the quality of phenotype evaluation of controls. Statistical significance: Fisher s exact test to determine the significance of observed excess in cases, OR, and EF. 2 points assigned
References Ressing, M., Blettner, M., Klug, SJ. Data analysis of epidemiological studies: part 11 of a series on evaluation of scientific publications. Dtsch Arztebl Int. 2010 Mar;107(11):187-92. doi: 10.3238/arztebl.2010.0187. Flanders, W.D., and Rhodes, P.H. Large sample confidence intervals for regression standardized risks, risk ratios, and risk differences. J Chronic Dis. 1987;40(7):697-704. PMID:3597672 Fletcher, R.H., Fletcher, S.W., and Wagner, E.H., Clinical Epidemiology: The Essentials. 3rd ed., Baltimore: Williams & Wilkins, 1996. Accessed online 26 October 2017 (http://202.74.245.22:8080/xmlui/bitstream/handle/123456789/405/Clinical%20Epidemiology%20by%20Ro bert%20H.%20Fletcher.pdf?sequence=1). McDonald, J.H. Handbook of Biological Statistics. 3rd ed., Baltimore: Sparky House Publishing, 2014. 77-85. Accessed online 24 October 2017 (http://www.biostathandbook.com/fishers.html). https://www.cancer.gov/publications/dictionaries/cancer-terms?cdrid=618612 https://www.statsdirect.com/help/meta_analysis/mh.htm