Cardio-metabolic Abnormalities Among Normal Weight Individuals: A Cross-sectional Analysis of Race/Ethnicity in the U.S.
Overweight and obesity are known cardio-metabolic risk factors, but this study delves into abnormalities among normal-weight individuals. The research compares data from MESA and MASALA studies, including diverse race/ethnicity groups like White, African American, Hispanic American, Chinese American, and South Asian American populations. BMI categories and methods of analysis are detailed to highlight the prevalence of cardio-metabolic risks in different racial/ethnic backgrounds.
Download Presentation

Please find below an Image/Link to download the presentation.
The content on the website is provided AS IS for your information and personal use only. It may not be sold, licensed, or shared on other websites without obtaining consent from the author.If you encounter any issues during the download, it is possible that the publisher has removed the file from their server.
You are allowed to download the files provided on this website for personal or commercial use, subject to the condition that they are used lawfully. All files are the property of their respective owners.
The content on the website is provided AS IS for your information and personal use only. It may not be sold, licensed, or shared on other websites without obtaining consent from the author.
E N D
Presentation Transcript
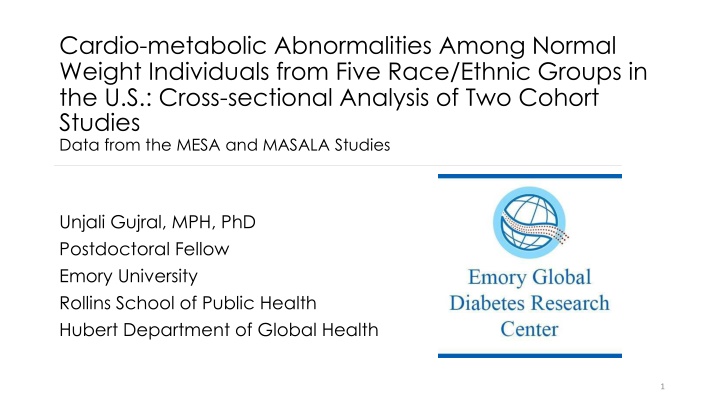
Cardio-metabolic Abnormalities Among Normal Weight Individuals from Five Race/Ethnic Groups in the U.S.: Cross-sectional Analysis of Two Cohort Studies Data from the MESA and MASALA Studies Unjali Gujral, MPH, PhD Postdoctoral Fellow Emory University Rollins School of Public Health Hubert Department of Global Health 1
INTRODUCTION Overweight and obesity are well known cardio-metabolic risk factors There has been some exploration of the prevalence of cardio-metabolic risk and correlates in normal weight individuals There have been no direct comparisons by race/ethnicity including East and South Asian populations 2
METHODS Cross-sectional analysis of pooled data from the Multi-Ethnic Study of Atherosclerosis (MESA) and the Mediators of Atherosclerosis in South Asians Living in America (MASALA) 3
MESA 2,622 whites, 803 Chinese Americans, 1,893 African Americans, 1,496 Hispanic Americans Aged 45-84 years Recruitment from greater New York, Baltimore, Chicago, Los Angeles, Minneapolis-Saint Paul, and Winston-Salem areas. Baseline data collection was conducted between July 2000 and July 2002. 4
MASALA 803 South Asian Americans Aged 40-84 years Analysis was done only on those aged 45-84 to remain consistent with MESA Recruitment from greater San Francisco Bay and Chicago areas Baseline data collection was conducted between October 2010 and March 2013 Approximately 90% foreign born 5 Median income, $88,000
MESA and MASALA MASALA was designed to have similar measures and methods to MESA to allow for specific cross race/ethnic comparisons Eligibility criteria was identical between the two studies Identical protocols were used for seated blood pressure and anthropometry. 6
BMI Categories WHO Standard cut-points for White, African-American and Hispanic participants Normal weight: 18.5-24.9 kg/m2 Overweight: 25.0-29.9 kg/m2 Obesity: 30 kg/m2 WHO Asian cut-points for South Asian and Chinese American participants Normal weight: 18.5-22.9 kg/m2 Overweight: 23.0-27.4 kg/m2 Obesity: 27.5 kg/m2 7
Classification of Cardio-metabolic abnormality (risk) Based on National Cholesterol Education Program-Adult Treatment Panel III criteria Considered cardio-metabolically abnormal if two or more of the following Low HDL- Cholesterol < 40 mg/dL in men, < 50 mg/dL in women High Triglycerides High Glucose High Blood Pressure Blood pressure 130/85 Fasting triglyceride level 150 mg/dL Fasting plasma glucose 100 mg/dL Any use of lipid lowering medication Any use of glucose lowering medication Any use of anti- hypertensive medication 8
Focused on discordant phenotype of cardio- metabolically abnormal, normal weight (MAN) 9
STATISTICAL ANALYSIS Pooled data from MESA and MASALA cohorts Prevalence of metabolic abnormality calculated by BMI strata Prevalence ratios of MAN by race/ethnicity compared to Whites were estimated using Poisson models Models were adjusted for demographic, behavioral, and ectopic fat measures 10
STATISTICAL ANALYSIS CONTINUED Estimated values of BMI values for race/ethnic minority groups resulting in the same prevalence of MAN as in Whites with BMI of 25 kg/m2 Fit a proportional odds model for the number of cardio-metabolic abnormalities Used group specific 4-knot cubic splines in BMI adjusting for sex and age 11
RESULTS Prevalence of BMI category in total MESA/MASALA Sample 41.5 32.9 25.6 NORMAL WEIGHT OVERWEIGHT OBESE Gujral UP, Vittinghoff E, Mongraw-Chaffin M, Vaidya D, Kandula NR, Allison M, Carr J, Liu K, Narayan KM, and Kanaya AM, 2017. Cardiometabolic Abnormalities Among Normal-Weight Persons From Five Racial/Ethnic Groups in the United StatesA Cross-sectional Analysis of Two Cohort StudiesCardiometabolic Abnormalities Among Normal-Weight Persons. Annals of Internal Medicine. 12
Prevalence of BMI Category by Race/Ethnicity 60 50 40 Prevalence (%) 30 20 10 0 Normal Weight Overweight Obese Overweight White Chinese African American Hispanic South Asian Gujral UP, Vittinghoff E, Mongraw-Chaffin M, Vaidya D, Kandula NR, Allison M, Carr J, Liu K, Narayan KM, and Kanaya AM, 2017. Cardiometabolic Abnormalities Among Normal-Weight Persons From Five Racial/Ethnic Groups in the United StatesA Cross-sectional Analysis of Two Cohort StudiesCardiometabolic Abnormalities Among Normal-Weight Persons. Annals of Internal Medicine. 13
Prevalence of Metabolic Abnormality in Normal Weight by Race/Ethnicity* 100 90 80 70 Prevalence (%) Metabolical ly Abnormal 60 50 40 30 20 10 0 White Chinese African American Hispanic South Asian Gujral UP, Vittinghoff E, Mongraw-Chaffin M, Vaidya D, Kandula NR, Allison M, Carr J, Liu K, Narayan KM, and Kanaya AM, 2017. Cardiometabolic Abnormalities Among Normal-Weight Persons From Five Racial/Ethnic Groups in the United StatesA Cross-sectional Analysis of Two Cohort StudiesCardiometabolic Abnormalities Among Normal-Weight Persons. Annals of Internal Medicine. 14
Characteristics of normal weight/metabolically abnormal (MAN) participants by race/ethnicity Chinese American N=104 African American N=104 South Asian N=85 White N=178 Hispanic N=97 Characteristics Men (%) 72.9 39.3* 47.1* 53.4* 50.5* Age (years) 59.6 (8.9) 68.0 (9.6)* 66.8 (9.0)* 67.0 (9.6)* 64.6 (10.9)* Diabetes (%) 38.8 7.9* 24.0 28.9 26.8* Hepatic fat attenuation (HU) 55.9 (9.5) 64.0 (10.2)* 64.3 (10.7)* 63.4 (9.5)* 63.7 (12.1)* Never Smoker % 81.2 46.6* 73.1 39.4* 66.0* Data are given as %, mean (standard deviation) *P value vs. South Asian 0.05. Gujral UP, Vittinghoff E, Mongraw-Chaffin M, Vaidya D, Kandula NR, Allison M, Carr J, Liu K, Narayan KM, and Kanaya AM, 2017. Cardiometabolic Abnormalities Among Normal-Weight Persons From Five Racial/Ethnic Groups in the United StatesA Cross-sectional Analysis of Two Cohort StudiesCardiometabolic Abnormalities Among Normal-Weight Persons. Annals of Internal Medicine. 15
Prevalence Ratios of the Metabolically Abnormal Phenotype Among Normal Weight Individuals Prevalence Ratio (95% CI) Unadjusted Multivariate Adjusted* Race/Ethnicity White 1.00 (Reference) 1.00 (Reference) South Asian 2.07 (1.69, 2.55) 2.53 (1.99, 3.22) Chinese 1.53 (1.25, 1.88) 1.27 (1.02, 1.59) African American 1.48 (1.20, 1.82) 1.66 (1.35, 2.04) Hispanic 1.83 (1.49, 2.24) 1.56 (1.26, 1.92) *Model is adjusted for age, sex education, alcohol use, smoking status, physical activity, daily caloric intake, hepatic fat attenuation, and pericardial fat volume. Gujral UP, Vittinghoff E, Mongraw-Chaffin M, Vaidya D, Kandula NR, Allison M, Carr J, Liu K, Narayan KM, and Kanaya AM, 2017. Cardiometabolic Abnormalities Among Normal-Weight Persons From Five Racial/Ethnic Groups in the United StatesA Cross-sectional Analysis of Two Cohort StudiesCardiometabolic Abnormalities Among Normal-Weight Persons. Annals of Internal Medicine. 16
Race/ethnic-specific BMI values associated with prevalence of MAN compared to Whites at BMI 25 kg/m2 100 South Asian Chinese Hispanic African American 90 80 White 70 60 Prevalence 50 40 (%) 30 20 10 0 25 15 20.9 21.5 19.6 22.9 BMI (kg/m2) 17
DISCUSSION Cross-sectional study that included participants from multiple race/ethnic groups in the United States Nearly one-third of individuals overall had the MAN phenotype Approximately 40% of South Asian and Hispanic participants had MAN. Adjustment for demographic, behavior and ectopic fat measures did not explain these differences 18
LIMITATIONS Differences in timing of data collection between studies (10 years) Differential use of food frequency questionnaires between studies Generalizability of results to younger individuals or South Asians and East Asians born in the United States 19
CONCLUSIONS High prevalence of cardio-metabolic abnormality in normal weight individuals Individuals from race/ethnic minority populations have highest prevalence of MAN Differences not explained by differences in demographic, behavioral or ectopic fat measures Using body mass index as the main criteria for screening (per USPSTF) may miss a large proportion of at-risk individuals and could increase gaps in the detection and diagnosis of cardiometabolic risk among race/ethnic minority populations Future research is needed to determine prospective associations between MAN and incident CVD 20
ACKNOWLEDGEMENTS Dr. Alka Kanaya Dr. Venkat Narayan Dr. Eric Vittinghoff Dr. Morganna Mongraw-Chaffin Dr. Dhananjay Vaidya Dr. Namratha Kandula Dr. Matthew Allison Dr. Jeffrey Carr Dr. Kiang Liu MESA and MASALA Study teams Participants from MESA and MASALA Studies 21
THANK YOU! Future Directions? Questions? 22
Supplemental Table 2. Prevalence of Risk Factor Combinations Among Individuals with Two or More Cardio- Metabolic Risk Factors by Race/Ethnicity Elevated Triglycerides/ High Blood Pressure N (%) Elevated Triglycerides/ Elevated Glucose N (%) Elevated Triglycerides/ Low HDL N (%) High Blood Pressure/Elev ated Glucose N (%) High Blood Pressure/Low HDL Elevated Glucose/Low HDL Cardio- metabolic Risk Factor Combinati ons N (%) N (%) 104 (9.25) 11 (0.98) 172 (15.3) 106 (9.43) 449 (39.95) 282 (25.09) White 23 (5.68) 13 (3.21) 51 (12.59) 58 (11.85) 119 (29.38) 151 (37.28) Chinese 38 (4.00) 7 (0.74) 24 (2.53) 211 (22.23) 324 (34.14) 345 (36.35) African American Hispanic 57 (6.58) 19 (2.19) 137 (15.82) 112 (12.93) 213 (24.60) 328 (37.88) 17 (3.79) 9 (2.01) 42 (9.38) 65 (14.51) 97 (21.65) 218 (48.66) South Asian 23
