Candy Bar Packing in Hexagonal Box
A chocolate company's new candy bars, shaped like prisms, are to be packed in a hexagonal box with specific dimensions. Learn how to graph absolute value, greatest integer, and signum functions with transformations in this problem-solving exercise.

Uploaded on Mar 06, 2025 | 0 Views
Download Presentation

Please find below an Image/Link to download the presentation.
The content on the website is provided AS IS for your information and personal use only. It may not be sold, licensed, or shared on other websites without obtaining consent from the author.If you encounter any issues during the download, it is possible that the publisher has removed the file from their server.
You are allowed to download the files provided on this website for personal or commercial use, subject to the condition that they are used lawfully. All files are the property of their respective owners.
The content on the website is provided AS IS for your information and personal use only. It may not be sold, licensed, or shared on other websites without obtaining consent from the author.
E N D
Presentation Transcript
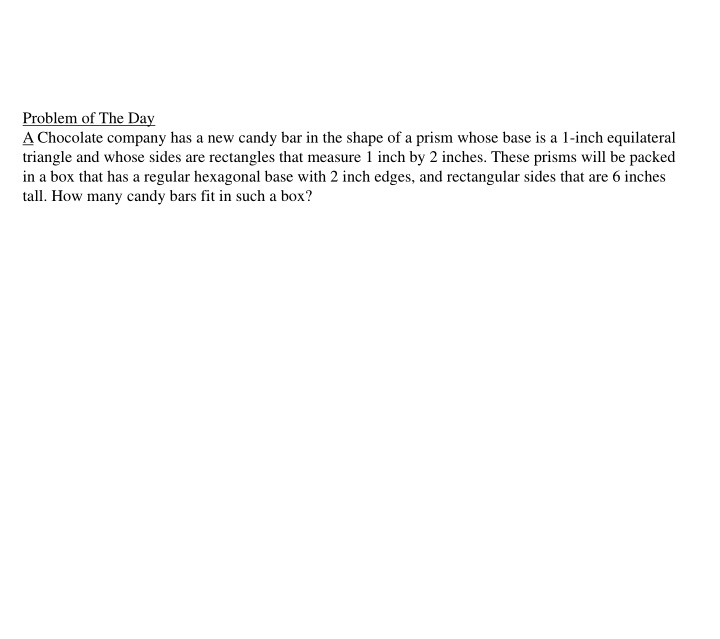
Problem of The Day A Chocolate company has a new candy bar in the shape of a prism whose base is a 1-inch equilateral triangle and whose sides are rectangles that measure 1 inch by 2 inches. These prisms will be packed in a box that has a regular hexagonal base with 2 inch edges, and rectangular sides that are 6 inches tall. How many candy bars fit in such a box?
Graphing Absolute values, Greatest Integer & Signum Functions TS: Making decisions after reflection and review Obj: Be able to graph each of the above kinds of functions with translations Warm Up: Re-write each absolute value expression as a piece-wise function.
Graph the below function. It is known as the Signum Function or f(x) = sgn(x). Now that we know what the graph of f(x) = sgn(x) looks like, graph the below signum functions using transformations.
Graph the below function. As you may recall from Algebra II it is called the Greatest Integer Function.
Now let's try some examples of graphing Greatest Integer Functions using transformations.
Now I want you to try graphing these and test your understanding of each!