Bottled Water Demand Trends in 2020
Water Continues to Flow Freely
According to analysis from the Beverage Marketing
Corporation (BMC), bottled water benefited from the
stockpiling of food and other household essentials during
the first half of 2020, but then demand declined slightly
because many on-premise outlets were closed.
BMC reported total 2020 bottled water volume was 15.0
billion gallons, a 4.2% increase from 2019. Single-serving
PET sizes were very popular as this segment increased
4% during 2020 to 10.5 billion gallons and accounted for
70.4% of total volume by segment.
Although the direct delivery/bulk segment was second in
volume at 9.3%, volume decreased during 2020 primarily
because offices and other commercial locations were
either closed or operating with few employees.
Activities Drive Consumption
Five selected Spring 2021 market surveys from The
Media Audit found cooking was the #1 activity
among adults 18+ when bottled water (still/sparkling)
was consumed during the past 7 days, ranging from
72.9% in Pittsburgh to 61.1% in Orlando and Seattle.
Jogging, running or walking was the second activity,
or Pittsburgh (37.6%), Orlando (32.3%), Houston
(35.8%), Phoenix (35.5%) and Seattle (35.8%).
Hiking was the third activity in which adults 18+
consumed bottled water, from 13.1% in Orlando to
11.4% in Houston; however, biking was third in
Phoenix at 17.9%.
Still Water Still Dominates
Of the total bottled water sales of $19.6 billion at multi-
outlets and convenience stores for the 52 weeks ending
5/16/21 (a 7.2% YOY increase), convenience/PET still
bottled waters accounted for 69.9% or $13.7 billion, a 5%
YOY increase.
Private label brands had a 44.6% share in the jug/bulk/still
waters segment, equating to $787.6 million in sales
through the same 52-week period, but both dollar-sales
share and market share decreased 0.6% YOY.
The Primo brand, fourth in the top five of the jug/bulk/still
waters segment, recorded the largest dollar-sales increase
or 6.4%. C.G. Roxanne Crystal Geyser was third with a
2.7% YOY dollar-sales increase. The segment’s total of
$1.76 billion only increased 0.8% YOY.
Sparking Waters’ Popularity Pops
The sparking water segment continues its streak of
double-digit growth, from 13.1% (2019) to 12.9% (2020) to
18.2% through the 52 weeks ending 5/16/21. Much of
sparkling waters’ popularity is the addition of functional
ingredients to enhance health and wellness.
Carbonation has always been a draw for sparkling water
fans, but bottlers continue to add more flavors, which is
also responsible for segment growth. For the same 52-
week period, the Sparkling Ice brand moved past private-
label brands to first place in the segment.
Enhanced waters also recorded a double-digit increase, or
12.8% YOY, totaling $2.2 billion and a 16.3% share of the
shelf-stable water segment. Specifically, refrigerated
coconuts and plant waters’ dollar volume of $60.7 million
was a 10.1% YOY increase.
The Bottled Water Consumer
Analyzing the same regional representative markets
from The Media Audit’s Spring 2021 consumer
surveys, adults 25–44 are the primary target audience
for still and sparkling water consumption, ranging from
42.2% in Seattle to 31.7% in Pittsburgh.
Adults 50–64 are the other target audience, or those
who had consumed one or more still or sparkling
water during the past seven days, ranging from 27.6%
in Pittsburgh to 21.6% in Orlando. In Phoenix, adults
55–74, at 24.6%, were second behind adults 25–44.
By household income, adults 18+ in the $50K–$150K
bracket are at least 44.9% (Houston) of still and
sparkling water consumers, but as much as 51.3% in
Seattle. Houston also has a large segment (35.0%) in
the $15K–$50K segment.
Media Consumption of
Bottled Water Consumers
Analysis of the typical media day of adults 25–44
who had consumed one or more still or sparkling
water during the past seven days was unsurprising,
as TV and the Internet were essentially equal in the
same selected markets and the obvious
complementary ad media.
Although larger percentages of adults 50–64 watch
TV during the typical media day, their increasing use
of the Internet, ranging from approximately 20% to
25%, indicates TV and the Internet are the best ad-
medium combinations to reach this audience too.
Of all adults 18+ who had consumed one or more
still or sparkling water during the past seven days,
YouTube was their #1 social media platform to use,
at more than 70% in the same five selected markets
from The Media Audit’s Spring 2021 surveys.
Advertising Strategies
Beverage retailers and on-premise establishments
can maximize bottled water sales by continuing to
emphasize the health and hydration benefits.
The Media Audit data at the bottom of page 1 of the
Profiler reveals multiple opportunities to advertise
bottled water as a beverage choice when consumers
are participating in the various activities listed.
Beverage retailers can also use The Media Audit at
the top of page 3 of the Profiler to create ad
messages that correlate with consumers’ attendance
at various entertainment venues,
New Media Strategies
The relationships between the activities and bottled-
water consumption on the bottom of page 1 of the
Profiler are also excellent topics for separate social
media posts, including short videos, to reach the
prime audience of adults 25–44.
As beverage companies continue to introduce more
sparkling and enhanced water flavors, local
beverage retailers can benefit from customer
testimonials of these new flavors and promote
special offers in email and social media campaigns.
With the growth of the cannabis market, especially
OTC hemp CBD beverages, retailers in states
where they can legally sell these products should
consider creating a regular presence on social
media sharing information about these products.
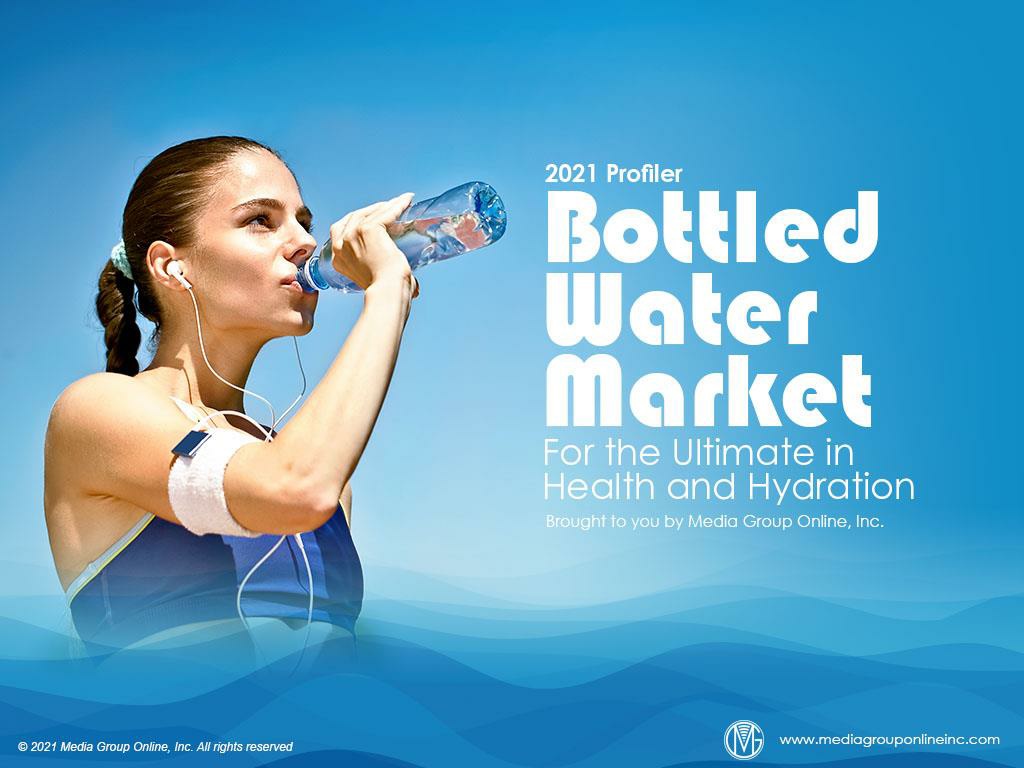
Bottled water saw a surge in demand during the first half of 2020 due to stockpiling, but faced a decline as on-premise outlets shut down. Learn about the latest trends in the bottled water industry from the analysis conducted by the Beverage Marketing Corporation (BMC).

Uploaded on Mar 03, 2025 | 0 Views
Download Presentation

Please find below an Image/Link to download the presentation.
The content on the website is provided AS IS for your information and personal use only. It may not be sold, licensed, or shared on other websites without obtaining consent from the author.If you encounter any issues during the download, it is possible that the publisher has removed the file from their server.
You are allowed to download the files provided on this website for personal or commercial use, subject to the condition that they are used lawfully. All files are the property of their respective owners.
The content on the website is provided AS IS for your information and personal use only. It may not be sold, licensed, or shared on other websites without obtaining consent from the author.
E N D
Presentation Transcript
Water Continues to Flow Freely According to analysis from the Beverage Marketing Corporation (BMC), bottled water benefited from the stockpiling of food and other household essentials during the first half of 2020, but then demand declined slightly because many on-premise outlets were closed. BMC reported total 2020 bottled water volume was 15.0 billion gallons, a 4.2% increase from 2019. Single-serving PET sizes were very popular as this segment increased 4% during 2020 to 10.5 billion gallons and accounted for 70.4% of total volume by segment. Although the direct delivery/bulk segment was second in volume at 9.3%, volume decreased during 2020 primarily because offices and other commercial locations were either closed or operating with few employees.
Activities Drive Consumption Five selected Spring 2021 market surveys from The Media Audit found cooking was the #1 activity among adults 18+ when bottled water (still/sparkling) was consumed during the past 7 days, ranging from 72.9% in Pittsburgh to 61.1% in Orlando and Seattle. Jogging, running or walking was the second activity, or Pittsburgh (37.6%), Orlando (32.3%), Houston (35.8%), Phoenix (35.5%) and Seattle (35.8%). Hiking was the third activity in which adults 18+ consumed bottled water, from 13.1% in Orlando to 11.4% in Houston; however, biking was third in Phoenix at 17.9%.
Still Water Still Dominates Of the total bottled water sales of $19.6 billion at multi- outlets and convenience stores for the 52 weeks ending 5/16/21 (a 7.2% YOY increase), convenience/PET still bottled waters accounted for 69.9% or $13.7 billion, a 5% YOY increase. Private label brands had a 44.6% share in the jug/bulk/still waters segment, equating to $787.6 million in sales through the same 52-week period, but both dollar-sales share and market share decreased 0.6% YOY. The Primo brand, fourth in the top five of the jug/bulk/still waters segment, recorded the largest dollar-sales increase or 6.4%. C.G. Roxanne Crystal Geyser was third with a 2.7% YOY dollar-sales increase. The segment s total of $1.76 billion only increased 0.8% YOY.
Sparking Waters Popularity Pops The sparking water segment continues its streak of double-digit growth, from 13.1% (2019) to 12.9% (2020) to 18.2% through the 52 weeks ending 5/16/21. Much of sparkling waters popularity is the addition of functional ingredients to enhance health and wellness. Carbonation has always been a draw for sparkling water fans, but bottlers continue to add more flavors, which is also responsible for segment growth. For the same 52- week period, the Sparkling Ice brand moved past private- label brands to first place in the segment. Enhanced waters also recorded a double-digit increase, or 12.8% YOY, totaling $2.2 billion and a 16.3% share of the shelf-stable water segment. Specifically, refrigerated coconuts and plant waters dollar volume of $60.7 million was a 10.1% YOY increase.
The Bottled Water Consumer Analyzing the same regional representative markets from The Media Audit s Spring 2021 consumer surveys, adults 25 44 are the primary target audience for still and sparkling water consumption, ranging from 42.2% in Seattle to 31.7% in Pittsburgh. Adults 50 64 are the other target audience, or those who had consumed one or more still or sparkling water during the past seven days, ranging from 27.6% in Pittsburgh to 21.6% in Orlando. In Phoenix, adults 55 74, at 24.6%, were second behind adults 25 44. By household income, adults 18+ in the $50K $150K bracket are at least 44.9% (Houston) of still and sparkling water consumers, but as much as 51.3% in Seattle. Houston also has a large segment (35.0%) in the $15K $50K segment.
Media Consumption of Bottled Water Consumers Analysis of the typical media day of adults 25 44 who had consumed one or more still or sparkling water during the past seven days was unsurprising, as TV and the Internet were essentially equal in the same selected markets and the obvious complementary ad media. Although larger percentages of adults 50 64 watch TV during the typical media day, their increasing use of the Internet, ranging from approximately 20% to 25%, indicates TV and the Internet are the best ad- medium combinations to reach this audience too. Of all adults 18+ who had consumed one or more still or sparkling water during the past seven days, YouTube was their #1 social media platform to use, at more than 70% in the same five selected markets from The Media Audit s Spring 2021 surveys.
Advertising Strategies Beverage retailers and on-premise establishments can maximize bottled water sales by continuing to emphasize the health and hydration benefits. The Media Audit data at the bottom of page 1 of the Profiler reveals multiple opportunities to advertise bottled water as a beverage choice when consumers are participating in the various activities listed. Beverage retailers can also use The Media Audit at the top of page 3 of the Profiler to create ad messages that correlate with consumers attendance at various entertainment venues,
New Media Strategies The relationships between the activities and bottled- water consumption on the bottom of page 1 of the Profiler are also excellent topics for separate social media posts, including short videos, to reach the prime audience of adults 25 44. As beverage companies continue to introduce more sparkling and enhanced water flavors, local beverage retailers can benefit from customer testimonials of these new flavors and promote special offers in email and social media campaigns. With the growth of the cannabis market, especially OTC hemp CBD beverages, retailers in states where they can legally sell these products should consider creating a regular presence on social media sharing information about these products.