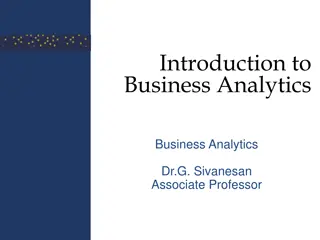
Big Data Analytics in Information Management


Name of the Staff : M.FLORENCE DAYANA
Head, Dept. of CA
Bon Secours College for Women
Thanjavur.
Class
: II – MSc., CS
Sub Code
: P16CSE5A
Semester
: IV

*
Big Data
Ana
lytics (BDA) is A new approach in
information management which provides a set of
capabilities for revealing additional value from BD.
*
It is defined as “
The process of examining large amounts
of data, from A variety of data sources and in different
formats, to deliver insights that can enable decisions in
real or near real time
”.
*
BDA is a different concept from those of Data Warehouse
(DW) or Business Intelligence (BI) systems.

*
The complexity of BD systems required the development of a
specialized architecture.
*
Now a days, the most commonly used BD architecture is hadoop.
*
It has redefined data management because it processes large
amounts of data, timely and at a low cost.
*
Social Networking
- Facebook, Twitter, Instagram,
Google+,etc.,
*
Sensors
-Used in aircrafts, cars, Industrial Machine,
Space Technology, CCTV Footage, etc.,
*
Data created from Transportation Services
– Aviation,
Railways, Shipping, etc.,
*
Online Shopping Portal
- Amazon, Flipcart, Snapdeal,
Alibaba, etc.,
*
Mobile Applications
– What’s App, Google Handout,
Hike, etc.,
*
Data created by Different Firms
– Education Institute,
Banks, Hospitals, Companies, etc.,
Big data challenges include capturing data, data storage, data
analysis, search, sharing, transfer, visualization, querying,
updating, information privacy and data source.
Big data was originally associated with three key concepts:
volume, variety, and velocity.
Challenges
1)
Capture
2)
Storage
3)
Duration
4)
Search
5)
Analysis
6)
Transfer
7)
Visualization
8)
Privacy violations
Dealing with data growth
Data today is growing at an exponential rate.
Most of the data that we have today has been generated
the last 2-3 years.
Generating insights in an timely manner
Infrastructure for big data as far as cost- efficiency,
elasticity, and easy upgrading/downgrading is concerned.
Recruiting and retaining big data talent
The other challenges is to decide on the period of
retention of big data. Just how long should one retain this
data? A tricky question indeed as some data is useful for
making long –term decisions.
Integrating disparate data source
There is a dearth of skilled professional s who
possess a high level of proficiency in data science that is
vital in implementation big data solution.
Validating data
The data changes are highly dynamic and therefore
there is a need to ingest this as quickly as possible.
Visualization
Data visualization is becoming popular as a separate
discipline. It short by quite a number, as far as business
visualization experts are concerned.
The Effect of Big Data on Information Technology Employment
New data and document control systems, software, and infrastructure to
move, process and store this information are being developed as we speak as
older systems are becoming obsolete.
Indeed, the amount of data we are generating is growing at an
exponential rate. Some of the resulting effects include:
*
Employment boom for specialists and IT professionals
*
Shortage of IT workers in US with specific skills to handle large pools of data
*
A developed need for employer-sponsored training programs
*
Call for the government to issue visas to foreign workers in US
Analytics is a process to take the data then apply some
mathematical and statistical algorithm or tool to build some model.
This model will be predictive and exploratory which is having
information that allow us to get insights and insights allow us to
take action.
1. DESCRIPTIVE – What happened?
2. DIAGNOSTIC – Why did it happen?
3. PREDICTIVE – What is likely to happen?
4. PRESCRIPTIVE – What should I do about it?
Most used Statistical Programming Tools:
•
IBM SPSS
•
SAS
•
Sata
•
R (Open Source)
•
MATLAB
Rest of the tools except ‘R’ are commercial and very expensive.
R and MATLAB has most comprehensive support of statistical
functions.
Data Creation
Collection of Data
Banks own HDFS for Storin
Fetching of Data
Model Formation
Knowing the insights of Model
Taking Action
*
Volume
: The amount of data collected from various resources
including e-business transaction (Paypal, Payatm, Airtel Money
etc), social media (Facebook, Twitter, Whatsapp), sensor
(weather monitoring, space sensor) and machine to machine
data (networking, IoT) by millions of user around the world. To
study such massive data Hadoop provide great too.
*
Velocity:
The massive stored data need unprecedented speed
with time constraint. In addition to device, it should be
connected in parallel with smart sensor and metering device in
real time process to keep the transparency of data.
*
Variety:
Data comes in two or more formats, but majorly as
structured data (numeric data in traditional databases) and
unstructured data (like stock ticker data, email, financial transactions,
audio, video and text documents)
Structured data
D
I
G
I
T
A
L
D
A
T
A
Semi Structured data
Unstructured data
Structured Data
*
This is the data which is in an organized form and
can be easily used by a computer program.
*
Relationship exist between entities of data such as
classes and their objects.
*
When data conforms to a pre-defined
scheme/structured we say it is structured data.
Structured data
Data base such as
oracle,DB2,Tera data
,My SQL, etc…
Spread sheet
OLTP systems
Semi structured data is also referred to as self
describing structured
I.
It does not conform to the data models that
one typically associates with rational database
or any others form of data tables
II.
It uses tag s to segregate semantic elements
Semi structured data
XML
Other mark up language
JSON
Semi structured data
Inconsistent structured data
Sell-describing
Other schema information .
Data objects may have
different attributes
Unstructured data does not conform to any
pre-defined data model.
Dealing with un
structured data
Data mining
Nature Language
Processing
(NLP)
Text Analysis
Noisy text analysis
•
Cassandra implements a Dynamo-style replication model
with no single point of failure, but adds a more powerful
“column family” data model.
Cassandra is being used by some of the biggest
companies such as Facebook, Twitter, Cisco, Rackspace,
ebay, Twitter, Netflix, and more.
The following are some of the features of Cassandra:
Elastic scalability − Cassandra is highly scalable; it allows to add more
hardware to accommodate more customers and more data as per
requirement.
Always on architecture − Cassandra has no single point of failure and it is
continuously available for business-critical applications that cannot afford
a failure.
Fast linear-scale performance − Cassandra is linearly scalable, i.e., it
increases your throughput as you increase the number of nodes in the
cluster. Therefore it maintains a quick response time.
*
Flexible data storage − Cassandra accommodates all possible data
formats including: structured, semi-structured, and unstructured.
It can dynamically accommodate changes to your data structures
according to your need.
Easy data distribution − Cassandra provides the flexibility to
distribute data where you need by replicating data across multiple
data centers.
Transaction support − Cassandra supports properties like
Atomicity, Consistency, Isolation, and Durability (ACID).
Fast writes − Cassandra was designed to run on cheap commodity
hardware. It performs blazingly fast writes and can store hundreds
of terabytes of data, without sacrificing the read efficiency.
Cluster − A cluster is a component that contains one or more data
centers.
Commit log − The commit log is a crash-recovery mechanism in
Cassandra. Every write operation is written to the commit log.
Mem-table − A mem-table is a memory-resident data structure.
After commit log, the data will be written to the mem-table.
Sometimes, for a single-column family, there will be multiple
mem-tables.
SSTable − It is a disk file to which the data is flushed from the
mem-table when its contents reach a threshold value.
Bloom filter − These are nothing but quick, nondeterministic,
algorithms for testing whether an element is a member of a set. It
is a special kind of cache. Bloom filters are accessed after every
query.
*
Hive is a data warehouse infrastructure tool to process
structured data in Hadoop. It resides on top of Hadoop to
summarize Big Data, and makes querying and analyzing easy.
*
Initially Hive was developed by Facebook, later the Apache
Software Foundation took it up and developed it further as an
open source under the name Apache Hive. It is used by
different companies. For example, Amazon uses it in Amazon
Elastic Map Reduce.
*
Hive is not A relational database A design for On Line
Transaction Processing OLTP A language for real-time queries
and row-level updates
*
It stores schema in a database and
processed data into HDFS.
*
It is designed for OLAP. It provides SQL
type language for querying called
HiveQL or HQL.
*
It is familiar, fast, scalable, and
extensible.
*
The following diagram depicts the workflow
between Hive and Hadoop.
*
Big data
is more into collecting and accumulating
huge data
for
analysis afterward, whereas
IoT
is about simultaneously collecting
and processing
data
to make real-time decisions.
*
The
internet of things
, or IoT, is a system of interrelated
computing devices, mechanical and digital machines, objects,
animals or people that are provided with unique identifiers (UIDs)
and the ability to transfer data over a network without requiring
human-to-human or human-to-computer interaction.
The Internet of Things (IoT) may sound like a futuristic term, but it’s
already here and increasingly woven into our everyday lives. The concept is
simpler than you may think: If you have a smart TV, fridge, doorbell, or any
other connected device, that’s part of the IoT .
Example 1
: The region’s most popular theme park has released its own
app. It does more than just provide a map, schedule, and menu items (though
those are important); it also uses GPS pings to identify app users in line, thus
being able to display predicted wait times for rides based on density, even
being able to reserve a spot or trigger attra
ctions based on proximity.
*
A company’s devices are installed to use sensors for collecting and
transmitting data.
*
That big data—sometimes pentabytes of data—is then collected,
often in an repository called a data lake.
*
Both structured data from prepared data sources (user profiles,
transactional information, etc.) and unstructured data from other
sources (social media archives, emails and call center notes, security
camera images, licensed data, etc.) reside in the data lake.
*
Reports, charts, and other outputs are generated, sometimes by
AI-driven analytics platforms such as Oracle Analytics.
*
User devices provide further metrics through settings,
preferences, scheduling, metadata, and other tangible
transmissions, feeding back into the data lake for even heavier
volumes of big data.
*
IoT can help you manage your home in a more
effective way. It helps you to keep a check on your
home from a remote location.
*
IoT can help in better environment monitoring by
analyzing the air and the water quality.
*
IoT can help media companies to understand the
behaviour of their audience better and develop more
effective content targeted towards a specific niche.
RFIDs:
uses radio waves in order to electronically track the tags
attached to each physical object.
*
Sensors:
devices that are able to detect changes in an environment
(ex: motion detectors).
*
Nanotechnology:
as the name suggests, these are extremely small
devices with dimensions usually less than a hundred nanometers.
*
Smart networks:
(ex: mesh topology).
*
Smart Grids
*
Smart cities
*
Smart homes
*
Healthcare
*
Earthquake detection
*
Radiation detection/hazardous gas
detection
*
Smartphone detection
*
Water flow monitoring
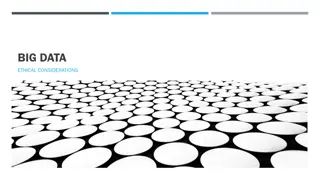
Big Data Analytics (BDA) is a powerful approach for extracting value from large data sets, offering insights for real-time decisions. It differs from traditional systems like Data Warehouses by leveraging specialized architectures like Hadoop. Various sources contribute to Big Data, posing challenges in data capture, storage, analysis, and privacy. Dealing with data growth requires scalable infrastructure for efficient processing.

Download Presentation

Please find below an Image/Link to download the presentation.
The content on the website is provided AS IS for your information and personal use only. It may not be sold, licensed, or shared on other websites without obtaining consent from the author.If you encounter any issues during the download, it is possible that the publisher has removed the file from their server.
You are allowed to download the files provided on this website for personal or commercial use, subject to the condition that they are used lawfully. All files are the property of their respective owners.
The content on the website is provided AS IS for your information and personal use only. It may not be sold, licensed, or shared on other websites without obtaining consent from the author.
E N D
Presentation Transcript
Big Data and Analytics Name of the Staff : M.FLORENCE DAYANA Head, Dept. of CA Bon Secours College for Women Thanjavur. Class : II MSc., CS Sub Code : P16CSE5A Semester : IV
Introduction *Big Data Analytics (BDA) is A new approach in information management which provides a set of capabilities for revealing additional value from BD. * It is defined as The process of examining large amounts of data, from A variety of data sources and in different formats, to deliver insights that can enable decisions in real or near real time . * BDA is a different concept from those of Data Warehouse (DW) or Business Intelligence (BI) systems.
Introduction * The complexity of BD systems required the development of a specialized architecture. *Now a days, the most commonly used BD architecture is hadoop. *It has redefined data management because it processes large amounts of data, timely and at a low cost.
Sources of Big Data *Social Networking - Facebook, Twitter, Instagram, Google+,etc., *Sensors -Used in aircrafts, cars, Industrial Machine, Space Technology, CCTV Footage, etc., *Data created from Transportation Services Aviation, Railways, Shipping, etc., *Online Shopping Portal - Amazon, Flipcart, Snapdeal, Alibaba, etc., *Mobile Applications What s App, Google Handout, Hike, etc., *Data created by Different Firms Education Institute, Banks, Hospitals, Companies, etc.,
Challenges with Big Data Big data challenges include capturing data, data storage, data analysis, search, sharing, transfer, visualization, querying, updating, information privacy and data source. Big data was originally associated with three key concepts: volume, variety, and velocity.
Challenges 1) Capture 2) Storage 3) Duration 4) Search 5) Analysis 6) Transfer 7) Visualization 8) Privacy violations
Dealing with data growth Data today is growing at an exponential rate. Most of the data that we have today has been generated the last 2-3 years. Generating insights in an timely manner Infrastructure for big data as far as cost- efficiency, elasticity, and easy upgrading/downgrading is concerned.
Recruiting and retaining big data talent The other challenges is to decide on the period of retention of big data. Just how long should one retain this data? A tricky question indeed as some data is useful for making long term decisions.
Integrating disparate data source There is a dearth of skilled professional s who possess a high level of proficiency in data science that is vital in implementation big data solution. Validating data The data changes are highly dynamic and therefore there is a need to ingest this as quickly as possible.
Visualization Data visualization is becoming popular as a separate discipline. It short by quite a number, as far as business visualization experts are concerned.
How Big Data Impact on IT The Effect of Big Data on Information Technology Employment New data and document control systems, software, and infrastructure to move, process and store this information are being developed as we speak as older systems are becoming obsolete. Indeed, the amount of data we are generating is growing at an exponential rate. Some of the resulting effects include: *Employment boom for specialists and IT professionals *Shortage of IT workers in US with specific skills to handle large pools of data *A developed need for employer-sponsored training programs *Call for the government to issue visas to foreign workers in US
What is Analytics Analytics is a process to take the data then apply some mathematical and statistical algorithm or tool to build some model. This model will be predictive and exploratory which is having information that allow us to get insights and insights allow us to take action.
Types of Analytics 1. DESCRIPTIVE What happened? 2. DIAGNOSTIC Why did it happen? 3. PREDICTIVE What is likely to happen? 4. PRESCRIPTIVE What should I do about it?
Tools of Analytics Most used Statistical Programming Tools: IBM SPSS SAS Sata R (Open Source) MATLAB Rest of the tools except R are commercial and very expensive. R and MATLAB has most comprehensive support of statistical functions.
Big Data Analytics in Banks Data Creation Collection of Data Banks own HDFS for Storin Fetching of Data Model Formation Knowing the insights of Model Taking Action
3 Vs of Big Data *Volume: The amount of data collected from various resources including e-business transaction (Paypal, Payatm, Airtel Money etc), social media (Facebook, Twitter, Whatsapp), sensor (weather monitoring, space sensor) and machine to machine data (networking, IoT) by millions of user around the world. To study such massive data Hadoop provide great too. *Velocity: The massive stored data need unprecedented speed with time constraint. In addition to device, it should be connected in parallel with smart sensor and metering device in real time process to keep the transparency of data.
3 Vs of Big Data * Variety: Data comes in two or more formats, but majorly as structured data (numeric data in traditional databases) and unstructured data (like stock ticker data, email, financial transactions, audio, video and text documents)
Types of Digital Data Structured data D I G I T A L Semi Structured data D A T A Unstructured data
Structured Data *This is the data which is in an organized form and can be easily used by a computer program. *Relationship exist between entities of data such as classes and their objects. *When data conforms to a pre-defined scheme/structured we say it is structured data.
Sources of Structured Data Data base such as oracle,DB2,Tera data ,My SQL, etc Structured data Spread sheet OLTP systems
Semi Structured Data Semi structured data is also referred to as self describing structured I. It does not conform to the data models that one typically associates with rational database or any others form of data tables II. It uses tag s to segregate semantic elements
Sources of Semi Structured Data XML Other mark up language Semi structured data JSON
Characteristics of Semi Structured Data Inconsistent structured data Sell-describing Semi structured data Other schema information . Data objects may have different attributes
Unstructured Data Unstructured data does not conform to any pre-defined data model. Data mining Nature Language Processing (NLP) Dealing with un structured data Text Analysis Noisy text analysis
Cassandra Apache Cassandra is an open source, distributed and decentralized/distributed storage system, for managing very large amounts of structured data. It provides highly available service with no single point of failure. It is scalable, fault-tolerant, and consistent. It is a column-oriented database. Its distribution design is based on Amazon s Dynamo and its data model on Google s Bigtable.
Cassandra implements a Dynamo-style replication model with no single point of failure, but adds a more powerful column family data model. Cassandra is being used by some of the biggest companies such as Facebook, Twitter, Cisco, Rackspace, ebay, Twitter, Netflix, and more.
Features of Cassandra The following are some of the features of Cassandra: Elastic scalability Cassandra is highly scalable; it allows to add more hardware to accommodate more customers and more data as per requirement. Always on architecture Cassandra has no single point of failure and it is continuously available for business-critical applications that cannot afford a failure. Fast linear-scale performance Cassandra is linearly scalable, i.e., it increases your throughput as you increase the number of nodes in the cluster. Therefore it maintains a quick response time.
* Flexible data storage Cassandra accommodates all possible data formats including: structured, semi-structured, and unstructured. It can dynamically accommodate changes to your data structures according to your need. Easy data distribution Cassandra provides the flexibility to distribute data where you need by replicating data across multiple data centers. Transaction support Cassandra supports properties like Atomicity, Consistency, Isolation, and Durability (ACID). Fast writes Cassandra was designed to run on cheap commodity hardware. It performs blazingly fast writes and can store hundreds of terabytes of data, without sacrificing the read efficiency.
Components of Cassandra The key components of Cassandra are as follows 1. Node 2. Data center 3. Cluster 4. Commit log 5. Mem-table 6. SSTable 7. Bloom filter Node It is the place where data is stored. Data center It is a collection of related nodes.
Cluster A cluster is a component that contains one or more data centers. Commit log The commit log is a crash-recovery mechanism in Cassandra. Every write operation is written to the commit log. Mem-table A mem-table is a memory-resident data structure. After commit log, the data will be written to the mem-table. Sometimes, for a single-column family, there will be multiple mem-tables. SSTable It is a disk file to which the data is flushed from the mem-table when its contents reach a threshold value. Bloom filter These are nothing but quick, nondeterministic, algorithms for testing whether an element is a member of a set. It is a special kind of cache. Bloom filters are accessed after every query.
* Cassandra Query Language Users can access Cassandra through its nodes using Cassandra Query Language (CQL). CQL treats the database Keyspace as a container of tables Write Operations Every write activity of nodes is captured by the commit logs written in the nodes. Captured data are stored in the mem-table. Whenever the mem-table is full, data will be written into the SStable data file. All writes are automatically partitioned and replicated throughout the cluster Read Operations During read operations, Cassandra gets values from the mem-table and checks the bloom filter to find the appropriate SSTable that holds the required data.
HIVE *Hive is a data warehouse infrastructure tool to process structured data in Hadoop. It resides on top of Hadoop to summarize Big Data, and makes querying and analyzing easy. *Initially Hive was developed by Facebook, later the Apache Software Foundation took it up and developed it further as an open source under the name Apache Hive. It is used by different companies. For example, Amazon uses it in Amazon Elastic Map Reduce. *Hive is not A relational database A design for On Line Transaction Processing OLTP A language for real-time queries and row-level updates
Features of Hive *It stores schema in a database and processed data into HDFS. *It is designed for OLAP. It provides SQL type language for querying called HiveQL or HQL. * It is familiar, fast, scalable, and extensible.
Working of Hive *The following diagram depicts the workflow between Hive and Hadoop.
BIG DATA & IOT *Big data is more into collecting and accumulating huge data for analysis afterward, whereas IoT is about simultaneously collecting and processing data to make real-time decisions. *The internet of things, or IoT, is a system of interrelated computing devices, mechanical and digital machines, objects, animals or people that are provided with unique identifiers (UIDs) and the ability to transfer data over a network without requiring human-to-human or human-to-computer interaction.
How Big Data Powers the Internet of Things The Internet of Things (IoT) may sound like a futuristic term, but it s already here and increasingly woven into our everyday lives. The concept is simpler than you may think: If you have a smart TV, fridge, doorbell, or any other connected device, that s part of the IoT . Example 1: The region s most popular theme park has released its own app. It does more than just provide a map, schedule, and menu items (though those are important); it also uses GPS pings to identify app users in line, thus being able to display predicted wait times for rides based on density, even being able to reserve a spot or trigger attractions based on proximity.
The Connection Between Big Data and IoT *A company s devices are installed to use sensors for collecting and transmitting data. *That big data sometimes pentabytes of data is then collected, often in an repository called a data lake. *Both structured data from prepared data sources (user profiles, transactional information, etc.) and unstructured data from other sources (social media archives, emails and call center notes, security camera images, licensed data, etc.) reside in the data lake.
*Reports, charts, and other outputs are generated, sometimes by AI-driven analytics platforms such as Oracle Analytics. *User devices provide further metrics through settings, preferences, scheduling, metadata, and other tangible transmissions, feeding back into the data lake for even heavier volumes of big data.
How Does IoT help *IoT can help you manage your home in a more effective way. It helps you to keep a check on your home from a remote location. *IoT can help in better environment monitoring by analyzing the air and the water quality. *IoT can help media companies to understand the behaviour of their audience better and develop more effective content targeted towards a specific niche.
IoT Enablers RFIDs: uses radio waves in order to electronically track the tags attached to each physical object. *Sensors: devices that are able to detect changes in an environment (ex: motion detectors). *Nanotechnology: as the name suggests, these are extremely small devices with dimensions usually less than a hundred nanometers. *Smart networks: (ex: mesh topology).
Modern Applications for IOT *Smart Grids *Smart cities *Smart homes *Healthcare *Earthquake detection *Radiation detection/hazardous gas detection *Smartphone detection *Water flow monitoring