Automated Anomaly Detection Tool for Network Performance Optimization
Anomaly Detection Tool (ADT) aims to automate the detection of network degradation in a mobile communications network, reducing the time and effort required significantly. By utilizing statistical and machine learning models, ADT can generate anomaly reports efficiently across a large circle network, addressing challenges such as manual analysis, miss tagging, and delayed mitigation. Through its architecture and experimentation outcomes, ADT showcases successful anomaly detection capabilities, enabling quick identification and resolution of issues to improve overall network performance.

Download Presentation

Please find below an Image/Link to download the presentation.
The content on the website is provided AS IS for your information and personal use only. It may not be sold, licensed, or shared on other websites without obtaining consent from the author.If you encounter any issues during the download, it is possible that the publisher has removed the file from their server.
You are allowed to download the files provided on this website for personal or commercial use, subject to the condition that they are used lawfully. All files are the property of their respective owners.
The content on the website is provided AS IS for your information and personal use only. It may not be sold, licensed, or shared on other websites without obtaining consent from the author.
E N D
Presentation Transcript
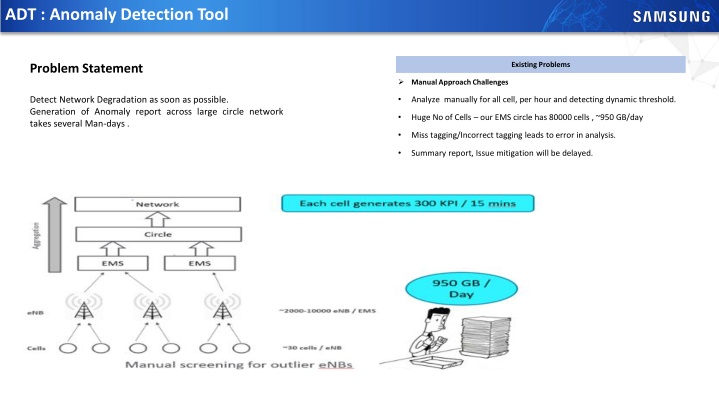
ADT : Anomaly Detection Tool Existing Problems Problem Statement Manual Approach Challenges Detect Network Degradation as soon as possible. Generation of Anomaly report across large circle network takes several Man-days . Analyze manually for all cell, per hour and detecting dynamic threshold. Huge No of Cells our EMS circle has 80000 cells , ~950 GB/day Miss tagging/Incorrect tagging leads to error in analysis. Summary report, Issue mitigation will be delayed.
ADT : KPIs Behavior Diamond Kpi Category Conclusions Connection: Setup Success Rate, Call Drop rate, Session time Problem in a mobile communications network can be directly mapped to anomalous behaviour of performance matrices collected from deployed NE (Network Elements). Quality: Throughput, Packet delay, No of connected user Data Volume: QCI 1/2/5/9 Mobility: Handover Success Rate, Handover Time Thus our goal is to automate anomaly detection using Statistical / ML models to reduce effort to less then an Hour across large circle network. KPI Gaussian Behavior There are multiple factors to be considered like number of users, climate conditions, geo-location, etc. affect KPIs.
ADT : Architecture Initialization Module Pre Processing Context Filtering (Week Day, Holiday) Highlights Derive Diamond KPI (Formula Based) 500 kPI to 67 KPI Load Kpi data/hourly Aggregated RAN: EMS Server Collect KPI /15 min There are expected fluctuations in KPIs across hours. Data Scaling Hourly, Per Cell (24 hours * 2 scalars * 80000 ) Big Data/ Sq-Lite Interface Outliers are detected using z- scores with help of hourly scalars for NEs computed over 30 days. Model Training Domain Labelling Model Validation Apply Z-Test (Tuneable Threshold/KPI) Labelling Train XG Boost model Good KPI Logic Tune Hyper Parameters Thresholds for detection are decided using feedbacks. Background Polling Job Anomaly Report Generation Re-Training After analysing, multiple machine learning algorithms like Isolation Forest, CBLOF, KNN, OCSVM, XGBOOST, Random Forest, XGBoost performed well on seen and unseen data. KPI Anomaly Frequency Summary Highlight Each anomaly/hour 5000*67 New Cell Training(15 Days) Existing Cell Update Scalers/day Model Training/Threshold based Reset Scalars Cell or NE or EMS level UI View /Web View summary Logging Module Asynchronous Future Scope Sub-Module Module
ADT : Experiment Outcomes Models And Results Highlights The labelled data obtained after pre-processing for hyper parameters tuning. Distance based: KNN,LOF(Local Outlier Factor),CBLOF(Clustering based LOF) Algorithms need to be updated with contamination value for best results. Contamination defines percentage of anomalous data within given sample set. Density Based: HDBSCAN (Hierarchical DBSCAN) Ensemble Based: IF(Isolation Forest), XG Boost XGBoost performed best along all the metrics on multiple circles in cellular network. High dimensional space based: OCSVM(One class support Vector Machine) EMS Accuracy Report Model Anomaly Cells Audit Anomaly Cells No of New Cells EMS Name Date Hour F1 Score Accuracy Precision Recall ROU AUC No of Cells EMS1 Day-n 15:00:00 0.99 0.99 1.00 0.99 0.98 61 3485 3506 3872 EMS2 Day-n 15:00:00 0.98 0.98 0.99 0.97 0.98 81 3497 3580 5063 EMS3 Day-n 15:00:00 0.99 0.98 0.99 0.99 0.98 115 3611 3643 4182 EMS4 Day-n 15:00:00 0.99 0.98 1.00 0.99 0.98 125 3812 3847 4320 EMS5 Day-n 15:00:00 0.99 0.99 1.00 0.99 0.98 140 4547 4571 5008 EMS6 Day-n 23:00:00 0.97 0.97 0.97 0.96 0.97 202 2500 2533 5069 One time testing Latest Live Internal Server testing for 1 EMS
ADT : Experiment Outcomes KPI Summary Report Executive Summary KPI's/Counts EMS1 EMS2 EMS3 EMS4 EMS5 Data Aggregation, Data Preprocessing, Domain Labelling DL Effective Mbps] 564 740 753 962 949 Model Training XG-Boost, Model validation UL Effective Throughput [Mbps] 241 506 440 513 264 POC tested with 17 EMS, with 96% accuracy(One time ) DL Volume (GB) 647 1151 1069 1037 698 UL Volume (GB) 335 768 651 631 351 Validated tool in Internal server with background logging, parallel execution, re-training and reset features on 1 EMS 5000 cells Avg. RRC Connected users 867 1706 1600 1344 922 Stability Bug fixes for 17 EMS volume of data UL Interference Power (dBm/RB) 613 554 651 1070 2089 Validation with live 17 EMS (80000 cells) for 2 week continuously IP Throughput (Mbps) 236 242 335 605 1209 Avg. Active UE-QCI1 542 1193 1046 1407 869 Large circle in centralized server (SNAP) Avg. Active UE-QCI9 450 1124 1016 855 505 PDCP Loss Rate-QCI1(%) 342 481 638 988 884
ADT : Advantages We need not have to build separate models for each cell. A single generalized model can work on multiple circles with great results. This approach accounts for changes across times of the day, and days across week. With this approach, we are able to get rid of any herculean and laborious manual process of labelling our data for anomalies. This approach adopts a combination of statistical approach with training a machine learning model, corroborating with domain experts in Telecom with whom we worked in collaboration. This model gives high accuracy for anomaly detection (~99%)