Appalachian Compact LLRW Disposal Data 2023 Revealed
Explore the detailed data on Low-Level Radioactive Waste disposal by the Appalachian Compact in 2023. This includes volume disposed and activity by state and facility type. Additionally, see the historical volume data from 2002 to 2023. Insights into LLRW disposal practices for West Virginia, Delaware, Maryland, and Pennsylvania are provided.
Uploaded on | 0 Views
Download Presentation

Please find below an Image/Link to download the presentation.
The content on the website is provided AS IS for your information and personal use only. It may not be sold, licensed, or shared on other websites without obtaining consent from the author. If you encounter any issues during the download, it is possible that the publisher has removed the file from their server.
You are allowed to download the files provided on this website for personal or commercial use, subject to the condition that they are used lawfully. All files are the property of their respective owners.
The content on the website is provided AS IS for your information and personal use only. It may not be sold, licensed, or shared on other websites without obtaining consent from the author.
E N D
Presentation Transcript
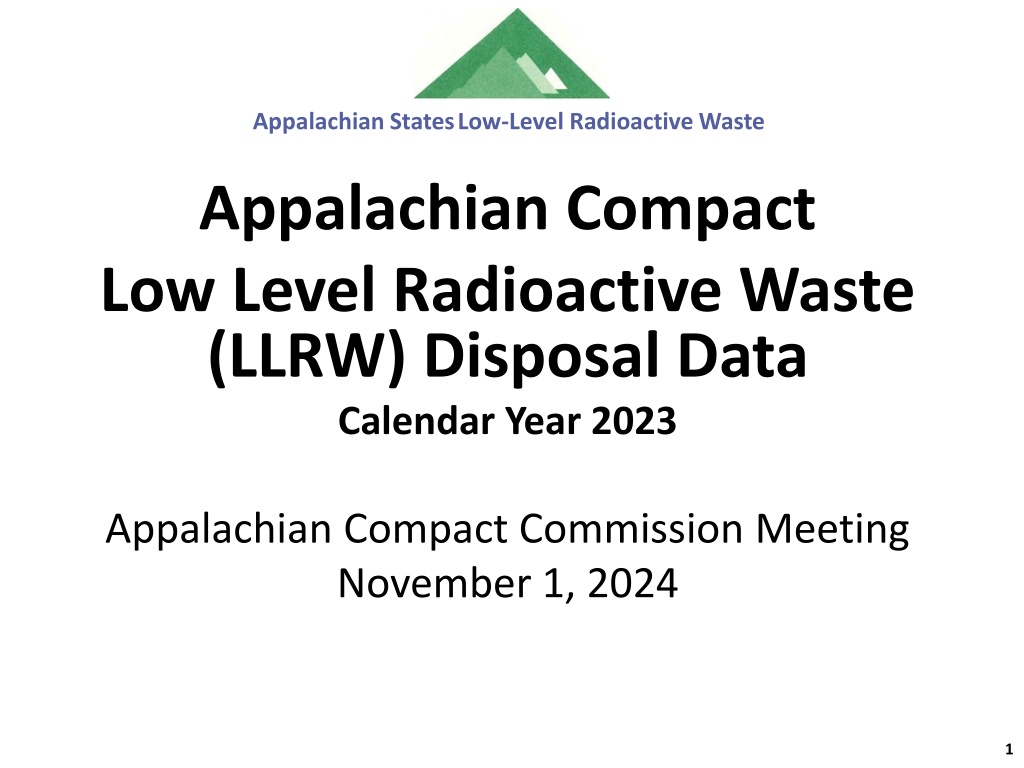
Appalachian States Low-Level Radioactive Waste Appalachian Compact Low Level Radioactive Waste (LLRW) Disposal Data Calendar Year 2023 Appalachian Compact Commission Meeting November 1, 2024 1
LLRW Volume Disposed 2023 Facility Type/State West Virginia Delaware Maryland Pennsylvania Totals Academic 42.0 0.0 4.0 29.5 75.5 Government 0.0 0.0 1427.7 22.8 1450.5 Industry 0.0 7.4 875.1 28181.0 29063.5 Medical 0.0 0.0 4.0 19.4 23.4 Utility 0.0 0.0 1171.2 40202.6 41373.8 Totals 42.0 7.4 3482.0 68455.3 71986.7 Volume is in cubic feet. This data is for Appalachian Compact LLRW disposal at EnergySolutions in Clive, Utah, and Waste Control Specialists in Andrews, Texas, for the calendar year 2023. 2
LLRW Activity Disposed 2023 Facility Type/State West Virginia Delaware Maryland Pennsylvania Totals Academic <0.1 0.0 <0.1 0.2 0.2 Government 0.0 0.0 8.6 <0.1 8.6 Industry 0.0 <0.1 0.1 55.5 55.6 Medical 0.0 0.0 <0.1 <0.1 0.0 Utility 0.0 0.0 106.2 28775.6 28881.8 Totals 0.0 0.0 114.9 28831.3 28946.2 Activity is in curies. This data is for Appalachian Compact LLRW disposal at EnergySolutions in Clive, Utah, and Waste Control Specialists in Andrews, Texas, for the calendar year 2023. 4
LLRW Volume in Ft3 from 2002 - 2023 Year 2002 2003 2004 2005 2006 2007 2008 2009 2010 2011 2012 2013 2014 2015 2016 2017 2018 2019 2020 2021 2022 2023 West Virginia 183.3 151.8 34.8 2.4 38.0 48.7 132.2 134.1 11.3 19.1 21.0 44.8 24.8 19.0 1.8 0.7 17.0 0.0 22.0 36.0 0.0 42.0 Delaware 366.4 73.5 48.8 74.2 59.2 42.7 414.8 431.2 29.4 1,061.0 75.2 339.5 42.7 45.2 4.5 34.1 0.0 26.0 2.7 8.0 1.5 7.4 Maryland 6,752.8 3,703.1 13,177.8 107,956.4 48,131.8 21,015.6 6,702.5 21,451.3 22,957.6 10,568.7 12,364.3 23,597.2 72,334.3 18,202.9 7,351.0 6,588.0 5,498.3 17,193.0 15,709.0 11,824.0 18,461.7 3,482.0 Pennsylvania 55,371.4 74,901.0 55,136.0 91,292.6 57,627.7 78,454.5 113,483.2 103,666.9 76,519.4 155,508.5 122,380.2 72,066.9 56,040.4 91,222.9 199,292.0 377,234.0 272,620.0 194,052.0 129,811.0 58,078.0 48,241.0 68,455.0 Total 62,673.9 78,829.4 68,397.4 199,325.6 105,856.7 99,561.5 120,732.7 125,683.5 99,517.7 167,157.3 134,840.7 96,048.4 128,442.2 109,490.0 206,649.0 383,857.0 278,135.0 211,271.0 145,545.0 69,946.0 66,704.2 71,986.4 Years 2002 to 2008 includes LLRW disposal at Barnwell, South Carolina, and Energy Solutions, Clive, Utah. 2009 to 2013 only includes LLRW disposal at EnergySolutions in Clive, Utah. Years 2014 to 2023 includes LLRW disposal at EnergySolutions in Clive, Utah, and Waste Control Specialists in Andrews, Texas. Total 2002 to 2023 984.8 3,188.0 475,023.3 2,551,454.6 Grand Total 3,030,651 6
LLRW Activity (Ci) from 2002 - 2023 Year 2002 2003 2004 2005 2006 2007 2008 2009 2010 2011 2012 2013 2014 2015 2016 2017 2018 2019 2020 2021 2022 2023 West Virginia 0.1 0.2 0.8 0.7 0.0 0.2 0.1 0.0 0.0 0.0 0.0 0.0 0.0 0.0 Delaware 0.5 24.7 0.2 31.3 11.9 12.9 12.2 0.5 0.0 1.0 0.0 45.3 0.0 0.0 Maryland 244.5 166.3 11,830.7 156.8 60.1 25,304.7 2,181.5 4.7 1.4 1.8 2.1 15.7 260.7 27.8 Pennsylvania 6,777.4 241,649.8 18,890.3 58,786.2 91,719.1 492,579.3 283,328.8 1,001.4 656.8 492.6 449.3 458.5 1,212.8 4,147.3 Total 7,022.5 241,841.0 30,722.0 58,975.0 91,791.1 517,897.1 285,522.6 1,006.6 658.2 495.4 451.4 519.5 1,473.5 4,175.1 2,229.5 1,889.8 42,152.8 906.7 1,213.5 1,683.0 846.5 28,946.2 Years 2002 to 2008 includes LLRW disposal at Barnwell, South Carolina, and EnergySolutions, Clive, Utah Years 2009 to 2013 LLRW includes disposal at EnergySolutions in Clive, Utah. 0.4 0.0 0.0 0.0 0.0 0.0 0.0 0.0 0.0 0.0 0.0 0.0 0.0 0.0 0.0 0.0 209.0 178.5 125.3 72.6 1.52 68.0 27.93 114.88 2,020.1 1,711.3 42,027.5 834.1 1,212.0 1,615.0 818.6 28,831.3 Years 2014 to 2023 includes LLRW disposal at EnergySolutions in Clive, Utah, and Waste Control Specialists in Andrews, Texas. Total 2002 to 2023 2.6 140.6 41,056.6 1,281,219.4 Grand Total 1,322,419 8
Thank you. Questions? Rich Janati, MS Administrator Appalachian Compact Commission Phone: 717-787-2163 rjanati@pa.gov 13

