Analysis of PEWS Implementation in UK and Australia: Chart Review
This analysis reviews the implementation of Pediatric Early Warning Score (PEWS) charts in England, Scotland, Wales, and Australia. It highlights the increase in PEWS usage, low mortality rates, and the need for standardized PEWS charts to improve care for acutely ill children. Findings include variations in age splits, score make-up, severity scores, and observed parameters. Additional features focus on sepsis recognition and escalation tools for concerns.
Download Presentation

Please find below an Image/Link to download the presentation.
The content on the website is provided AS IS for your information and personal use only. It may not be sold, licensed, or shared on other websites without obtaining consent from the author.If you encounter any issues during the download, it is possible that the publisher has removed the file from their server.
You are allowed to download the files provided on this website for personal or commercial use, subject to the condition that they are used lawfully. All files are the property of their respective owners.
The content on the website is provided AS IS for your information and personal use only. It may not be sold, licensed, or shared on other websites without obtaining consent from the author.
E N D
Presentation Transcript
PEWS Chart Review An analysis of 18 sites in England, Scotland Wales & Australia Updated: 19thSeptember 2019 www.england.nhs.uk
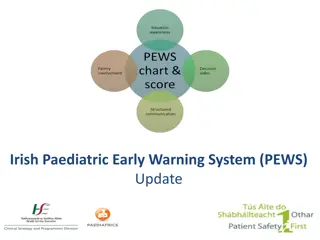
1. Background Increase in use of PEWS: A survey of organisations providing services to children in ED, assessment or in-patient settings in 2011 showed that the implementation of PEWS, in the UK, had increased from 21% in 2005 to 85% [based on preliminary data] . Mortality is low: Increasingly there has been a realisation the mortality is only a small facet of the benefits that a PEWS may provide to children within an in- patient setting. Avoidable mortality: However, of those cases, some reports suggest that approximately 50% of deaths in hospitalised children are associated with avoidable factors Managing acutely ill children: Local and national case reviews demonstrate some persistent errors in the management of acutely unwell children. www.england.nhs.uk
2. Purpose of this review: As part of the National PEWS programme, we agreed to undertake a review of PEWS (Paediatric Early Warning Score) charts currently in use within England. Feedback from coroners, the CQC and CEMACH as well variations noted in evidence-based reviews on existing scores and systems suggested a national PEWS chart would provide safer care. The purpose of this presentation is to illustrate the similarities and differences within the charts with a view to seeking agreement on core elements of a national PEWS chart. www.england.nhs.uk
3. RCN standards for measuring CYP vital signs The vital signs include: Heart/pulse rate, Respiratory rate and effort, Blood pressure, Oxygen saturations, Capillary refill time, Level of consciousness Temperature. Weight & height Standards for Assessing, Measuring and Monitoring Vital Signs in Infants, Children and Young People https://www.rcn.org.uk/professional- development/publications/pub-005942 www.england.nhs.uk
3. Chart review findings We reviewed 18 charts from across England but also Scotland and Australia and found: Age: The most common split for ages is 0-1 year, 1-4 years, 5-12 years, 12+ years with most variation for infants as some sites further divide the 0-1 age group. Score make-up: There was wide variation in how many values make up the score with fewest values 0-4 and the most 0-19. The average was approximately 1-7. Severity score: An area of potential confusion highlighted is that not all scores had the higher value representing greater concern. Observations measured: Parameters measured were remarkably similar although there was variation around whether the BP is part of the score and how behavioural change and parental/nurse concern are scored. www.england.nhs.uk
3. Chart review findings (continued) Additional features: The most frequent additional features were a recognition and management of sepsis and tools for escalation when there is concern or a score that requires a response. Areas that would have to be hospital specific: The only area of the chart that would have to be specific is the contact details for bleeps and ward extensions. Overall format: The format could be generic with contact details in the same place on each chart with just the actual ward/on call numbers varying between hospitals. This would still provide continuity for where to find escalation numbers when staff work across different hospitals. Hospital name could also be printed on the form in a standardised format and location. www.england.nhs.uk
4. Example parameter: Heart Rate High heart rate score in pre-teenage school children Site and score Barts Brighton Bristol 1 110 120 120 2 130 150 130 3 4 150 170 150 5 6 7 Score 0 - >8 1-6 0 - >16 160 180 190 200 130 110 120 120 120 140 0 - >5 0 - >8 1- >9 1 - >9 1 - 6 Scotland Wales Barnsley Birmingham Chelsea & Westminster Gloucestershire GOSH Manchester Nottingham Poole Portsmouth St Georges SW England 130 140 140 130 150 160 160 150 140 160 170 180 120 120 120 120 120 120 121 120 130 140 140 150 160 150 160 170 180 0 - 6 1 - 9 0 - >4 1- >12 0-7 1-5 0 - >8 0-19 130 130 130 150 140 140 140 140 150 150 160 160 170 170 180 180 160 www.england.nhs.uk
5. Example parameter: Resp Rate High resp rate score in pre-school children Site and score Barts Brighton Bristol Scotland Wales Barnsley Birmingham Chelsea & Westminster Gloucestershire GOSH Manchester Nottingham Poole Portsmouth St Georges SW England 1 40 50 40 35 40 40 40 40 2 60 60 60 3 4 70 80 70 Score 0 - >8 1-6 0 - >16 0 - >5 0 - >8 1- >9 1 - >9 1 - 6 70 50 60 60 60 50 70 70 70 70 60 35 40 30 30 30 40 30 40 40 60 50 60 70 45 0 - 6 0 - >4 1- >12 0-7 1-5 0 - >8 0-19 40 40 50 40 60 50 50 60 60 70 70 www.england.nhs.uk
6. Example parameter: Blood pressure Low blood pressure (systolic) score in pre-school children Site and score Barts Brighton Bristol Scotland Wales Barnsley Birmingham Chelsea & Westminster 1 2 80 doesn t 80 3 4 70 Score 0 - >8 1-6 0 - >16 0 - >5 0 - >8 1- >9 1 - >9 1 - 6 BP score 70 80 90 80 80 BP 70 80 60 60 doesn t 70 50 50 score BP 80 84 85 BP 80 score 0 - 6 1 - 9 0 - >4 1- >12 0-7 1-5 0 - >8 0-19 Gloucestershire GOSH Manchester Nottingham Poole Portsmouth St Georges SW England doesn t 60 50 70 75 doesn t 70 65 score 60 70 50 80 70 www.england.nhs.uk
7. Example parameter: Saturation Sats score in pre-school children Site and score Barts Brighton Bristol Scotland Wales Barnsley Birmingham Chelsea & Westminster 1 94 Sats 94 93 94 94 94 Sats 2 90 don t 3 4 Score 0 - >8 1-6 0 - >16 0 - >5 0 - >8 1- >9 1 - >9 1 - 6 score 91 91 89 90 91 score don t Sats 94 Sats 93 91 Sats 94 score 0 - 6 1 - 9 0 - >4 1- >12 0-7 1-5 0 - >8 Gloucestershire GOSH Manchester Nottingham Poole Portsmouth St Georges (POPS) don t 91 score 89 don t score don t 89 94 91 0-19 SW England www.england.nhs.uk
8. Conclusion: The middle of the bell curve chart Age: 0-1, 1-4, 5-12, 12+ (with some splitting the 0-1 age group) Score: Nearly all were around 1-7 or 8 with one 1-4 and on 1-19 Observations: Resp rate and Heart rate always included Then a mix of BP, Sats, Needing oxygen, CRT, Behaviour, Nurse/parental concern, Resp distress, Temp, Conscious level, Pain score, Pupils NB. Higher score charts tended to look at more parameters Additional features: Sepsis 6, Escalation tool eg. SBAR, Urine output, phlebitis score, GCS, On call bleeps, Epidural/block record chart, blood gas www.england.nhs.uk
