Africa Centres of Excellence Project Progress Report
Progress report detailing the key overall status, achievements, cumulative project results, student enrollment by course type, region, and gender, as well as outreach and regionality efforts in the Africa Centres of Excellence Project.
Download Presentation

Please find below an Image/Link to download the presentation.
The content on the website is provided AS IS for your information and personal use only. It may not be sold, licensed, or shared on other websites without obtaining consent from the author.If you encounter any issues during the download, it is possible that the publisher has removed the file from their server.
You are allowed to download the files provided on this website for personal or commercial use, subject to the condition that they are used lawfully. All files are the property of their respective owners.
The content on the website is provided AS IS for your information and personal use only. It may not be sold, licensed, or shared on other websites without obtaining consent from the author.
E N D
Presentation Transcript
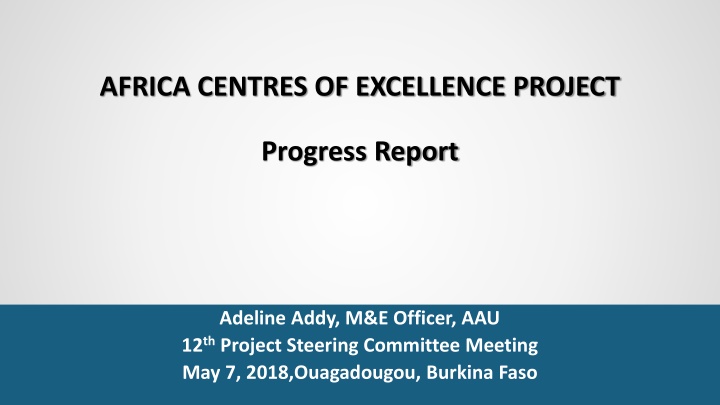
AFRICA CENTRES OF EXCELLENCE PROJECT Progress Report Adeline Addy, M&E Officer, AAU 12th Project Steering Committee Meeting May 7, 2018,Ouagadougou, Burkina Faso
OUTLINE 1. KEY OVERALL STATUS Student Enrollment (Regionality and gender) Quality Education & Research (Accreditation; External Revenue; New/revised Curricula & Research Publications) Outreach & Regionality (Internships & Partnerships) 2. SUMMARY DLR ACHIEVEMENT/EARNINGS
CUMULATIVE PROJECT PDO RESULTS Disbursement-linked Indicators (DLIs) Jan Dec 2017 Actual Results 2017 Cumulative Results YR 4 Cumulative Targets Progress to Project End Targets PROJECT DEVELOPMENT OBJECTIVES (PDO) 8,009 16,068 2,263 4,447 Total Students Regional Students 20,115 6,158 80% 72% Accreditation Internships External Revenue 105 1,183 143 3,468 210 8,393 68% 41% 23% $13,682.00 $33,946,954 $146,107,236 INTERMEDIATE RESULTS 2,697 Faculty Trained 1,142 1,435 ACHIEVED New/Revised Curricula 48 195 219 89% Research Publications 777 1,919 1,550 ACHIEVED New Partnerships 102 330 272 ACHIEVED Project Meetings 281 740 270 ACHIEVED
STUDENT ENROLLMENT ENROLMENT BY COURSE TYPE 8,326 6,849 Total Number of Students Enrolled 1,591 16,068 STC MSC PHD ENROLLMENT BY REGION Regional, 4019, 25% 8,009 National , 11795, 4,747 2,487 825 ENROLLMENT BY GENDER Female, 4,023, 25% 2014 2015 2016 2017 TOTAL Male , 11,791, 75% Regional (Total) Actual National (Total) Actual Total number of enrolled students Actual
REGIONAL ENROLLMENT BY COURSE Regional PhD Regional STC Regional MSc 500 120% 3,500 120% 2,500 120% 2,244 450 429 3,000 100% 100% 100% 400 2,000 2,500 350 80% 80% 80% 1,500 300 2,000 60% 60% 250 60% 1,038 1,019 1,500 188 1,000 200 40% 40% 40% 1,000 617 150 116 494 408 500 344 100 286 20% 20% 66 20% 500 59 115 50 - - 0% - 0% - 0% 2014 2015 2016 2017 TOTAL 2014 2015 2016 2017 TOTAL 2014 2015 2016 2017 TOTAL Actual Total Actual Total Actual Total Target Total Target Total Target Total
OUTREACH & REGIONALITY Internships Partnerships 6,000 350 330 4,835 300 5,000 250 4,000 200 2,831 3,000 163 150 2,055 2,000 1,764 113 102 95 100 1,183 79 1,016 916 1,000 39 50 396 36 336 29 0 0 - - 2014 2015 2016 2017 TOTAL No of partnerships between ACEs & PIs Target No of partnerships between ACEs & PIs Actual Internships Actual Internships Target
QUALITY EDUCATION & RESEARCH Accreditation by Type International Accreditation: 1. 2iE (Burkina Faso) Gap/Self Assessment, 7, 6% 2. CERSA (Togo) 3. CETIC (Cameroon) 4. MITIC (Senegal) International , 16, 14% 5. WACCBIP (Ghana) Regionl/Nati onal, 93, 80%
External Revenue Generated ACE ACEGID ACENTFDB ACEPRD CEA-CCBAD CEADESE CEA-MITIC CEFTER CERSA CETIC DRYLAND AGRIC KNUST OAU-OAK PARK PAMI WACCBIP WACCI CEA-SAMEF CEA-SMA CEFOR 2iE CERHI ENSEA CEA-MEM (INP-HB) 2014 886,000 0 0 0 22,000 0 0 0 250,000 43,572 0 6,349 0 295,844 1,887,702 1,643,565 2,075,845 1,804,340 0 85,100 0 68,500 1,219,896 1,584,976 1,212,400 3,205,457 1,031,887 1,358,838 369,963 0 27,000 0 0 0 0 2015 232,232 1,218,232 0 4,026 0 30,031 0 83,333 23,350 200,000 613,498 0 196,912 0 638,254 2016 2017 906,536 113,385 217,094 255,956 77,041 242,944 138,503 397,137 200,000 251, 732 1,212,819 968,237 0 1,012,823 Total 3,243,000 258,170 256,335 255,956 205,187 262,868 355,078 479,222 1,100,000 657,070 1,577,408 1,180,677 0 2,635,712 7,411,451 206,180 903,104 7,222,729 3,807,008 193,480 1,796,932 7,387 100000000 45% 40% 90000000 144,785 35,215 0 76,116 19,924 133,242 58,735 450,000 261, 358 364,590 9,179 0 688,791 40% 37% 80000000 33% 35% 70000000 27% 30% 60000000 25% 50000000 20% 40000000 15% 30000000 10% 20000000 107,880 834,604 13,200 0 5% 10000000 0 0% 1,046,320 65,892 1,796,932 7,387 2015 2016 2017 TOTAL 100,588 0 0 Amt generated Target Amt generated Actual TOTAL 5,643,249 6,789,615 7,900,088 13,682,002 34,014,954 Amt generated Progress toward target
Research Publications matched % ACE submitted matched 900 CEFTER WACCBIP CEA-SMA CENTDFB ACEGID DRY-LAND AGRIC CEA-SAMEF PAMI CERSA CEA-2iE CETIC CEFOR ACEPRD WACCI CEA-MITIC CEADESE RWESCK KNUST OAU-OAK CEA-CCBAD CERHI MEM / INP-HB 85 263 103 184 236 55 198 336 44 159 547 261 170 65 266 413 113 70 89 65 47 85 262 101 179 229 53 189 310 40 144 479 225 143 54 213 276 72 38 46 23 100% 100% 98% 97% 97% 96% 95% 92% 91% 91% 88% 86% 84% 83% 80% 67% 64% 54% 52% 35% 17% 800 700 600 500 400 300 200 100 - 2015 2016 2017 No. of Int'l research publications Target 8 No. of Int'l research publications Actual
Overall Achievement of DLR DLR TOTAL EARNED (SDR) TOTAL MAX SDR % OF MAX SDR EARNED DLR 1: Institutional Readiness 9,769,861 9,769,861 100% DLR 2.1 - 2.4: Enrollments & Internships 10,641,496 25,814,652 41% DLR 2.5: Accreditation 4,345,000 10,349,861 42% DLR 2.6: Research Publications 8,483,793 10,349,861 82% DLR 2.7: External Revenue 6,408,955 15,494,791 41% DLR 2.8: Learning Environment 7,269,017 20,489,722 35% DLR 3.1 - 3.4: Fiduciary Management 1,828,354 4,814,930 38% DLR 4: Procurement 910,000 4,814,930 19% TOTAL 49,656,476 101,898,609 49%
THANK YOU FOR YOUR KIND ATTENTION JE VOUS REMERCIE DE VOTRE ATTENTION
